Sharing your performance data without including industry-specific social media benchmarks is like putting on a play without setting the stage. Sure, people will get what you’re saying, but they’ll probably come to their own conclusions about the bigger picture.
Industry benchmarks provide the context needed to tell a richer story about your social media marketing strategy.
Use data from Sprout’s 2023 Content Benchmarks Report to illuminate opportunities to fine-tune your strategy in a way that resonates with your target audience. Before diving into the data, keep reading to learn more about the metrics, why they matter and how you can use them to make sure that 2023 is your best year yet.
What to measure in 2023: Social media benchmarks by industry
The Content Benchmarks Report analyzed more than 523 million messages from 729,000 public social profiles to pull industry benchmarks on three specific areas: posts published, inbound engagements and outbound engagements.
Here’s a full breakdown of each metric, including tips on how they can support your strategy. Download the report for a full look at the data.
Download the 2023 Content Benchmarks Report
Posts published
Posts published is a straightforward metric. It measures the number of posts published across accounts during a specific period. While this may seem simple, it’s often at the foundation of a successful social media strategy.
Narrowing in on posts published can help you reverse engineer the publishing volume needed to reach certain impressions, engagements and engagement rates. If your social media goals are data-informed, then figuring out how to reach them is just a matter of reviewing your previous performance reports.
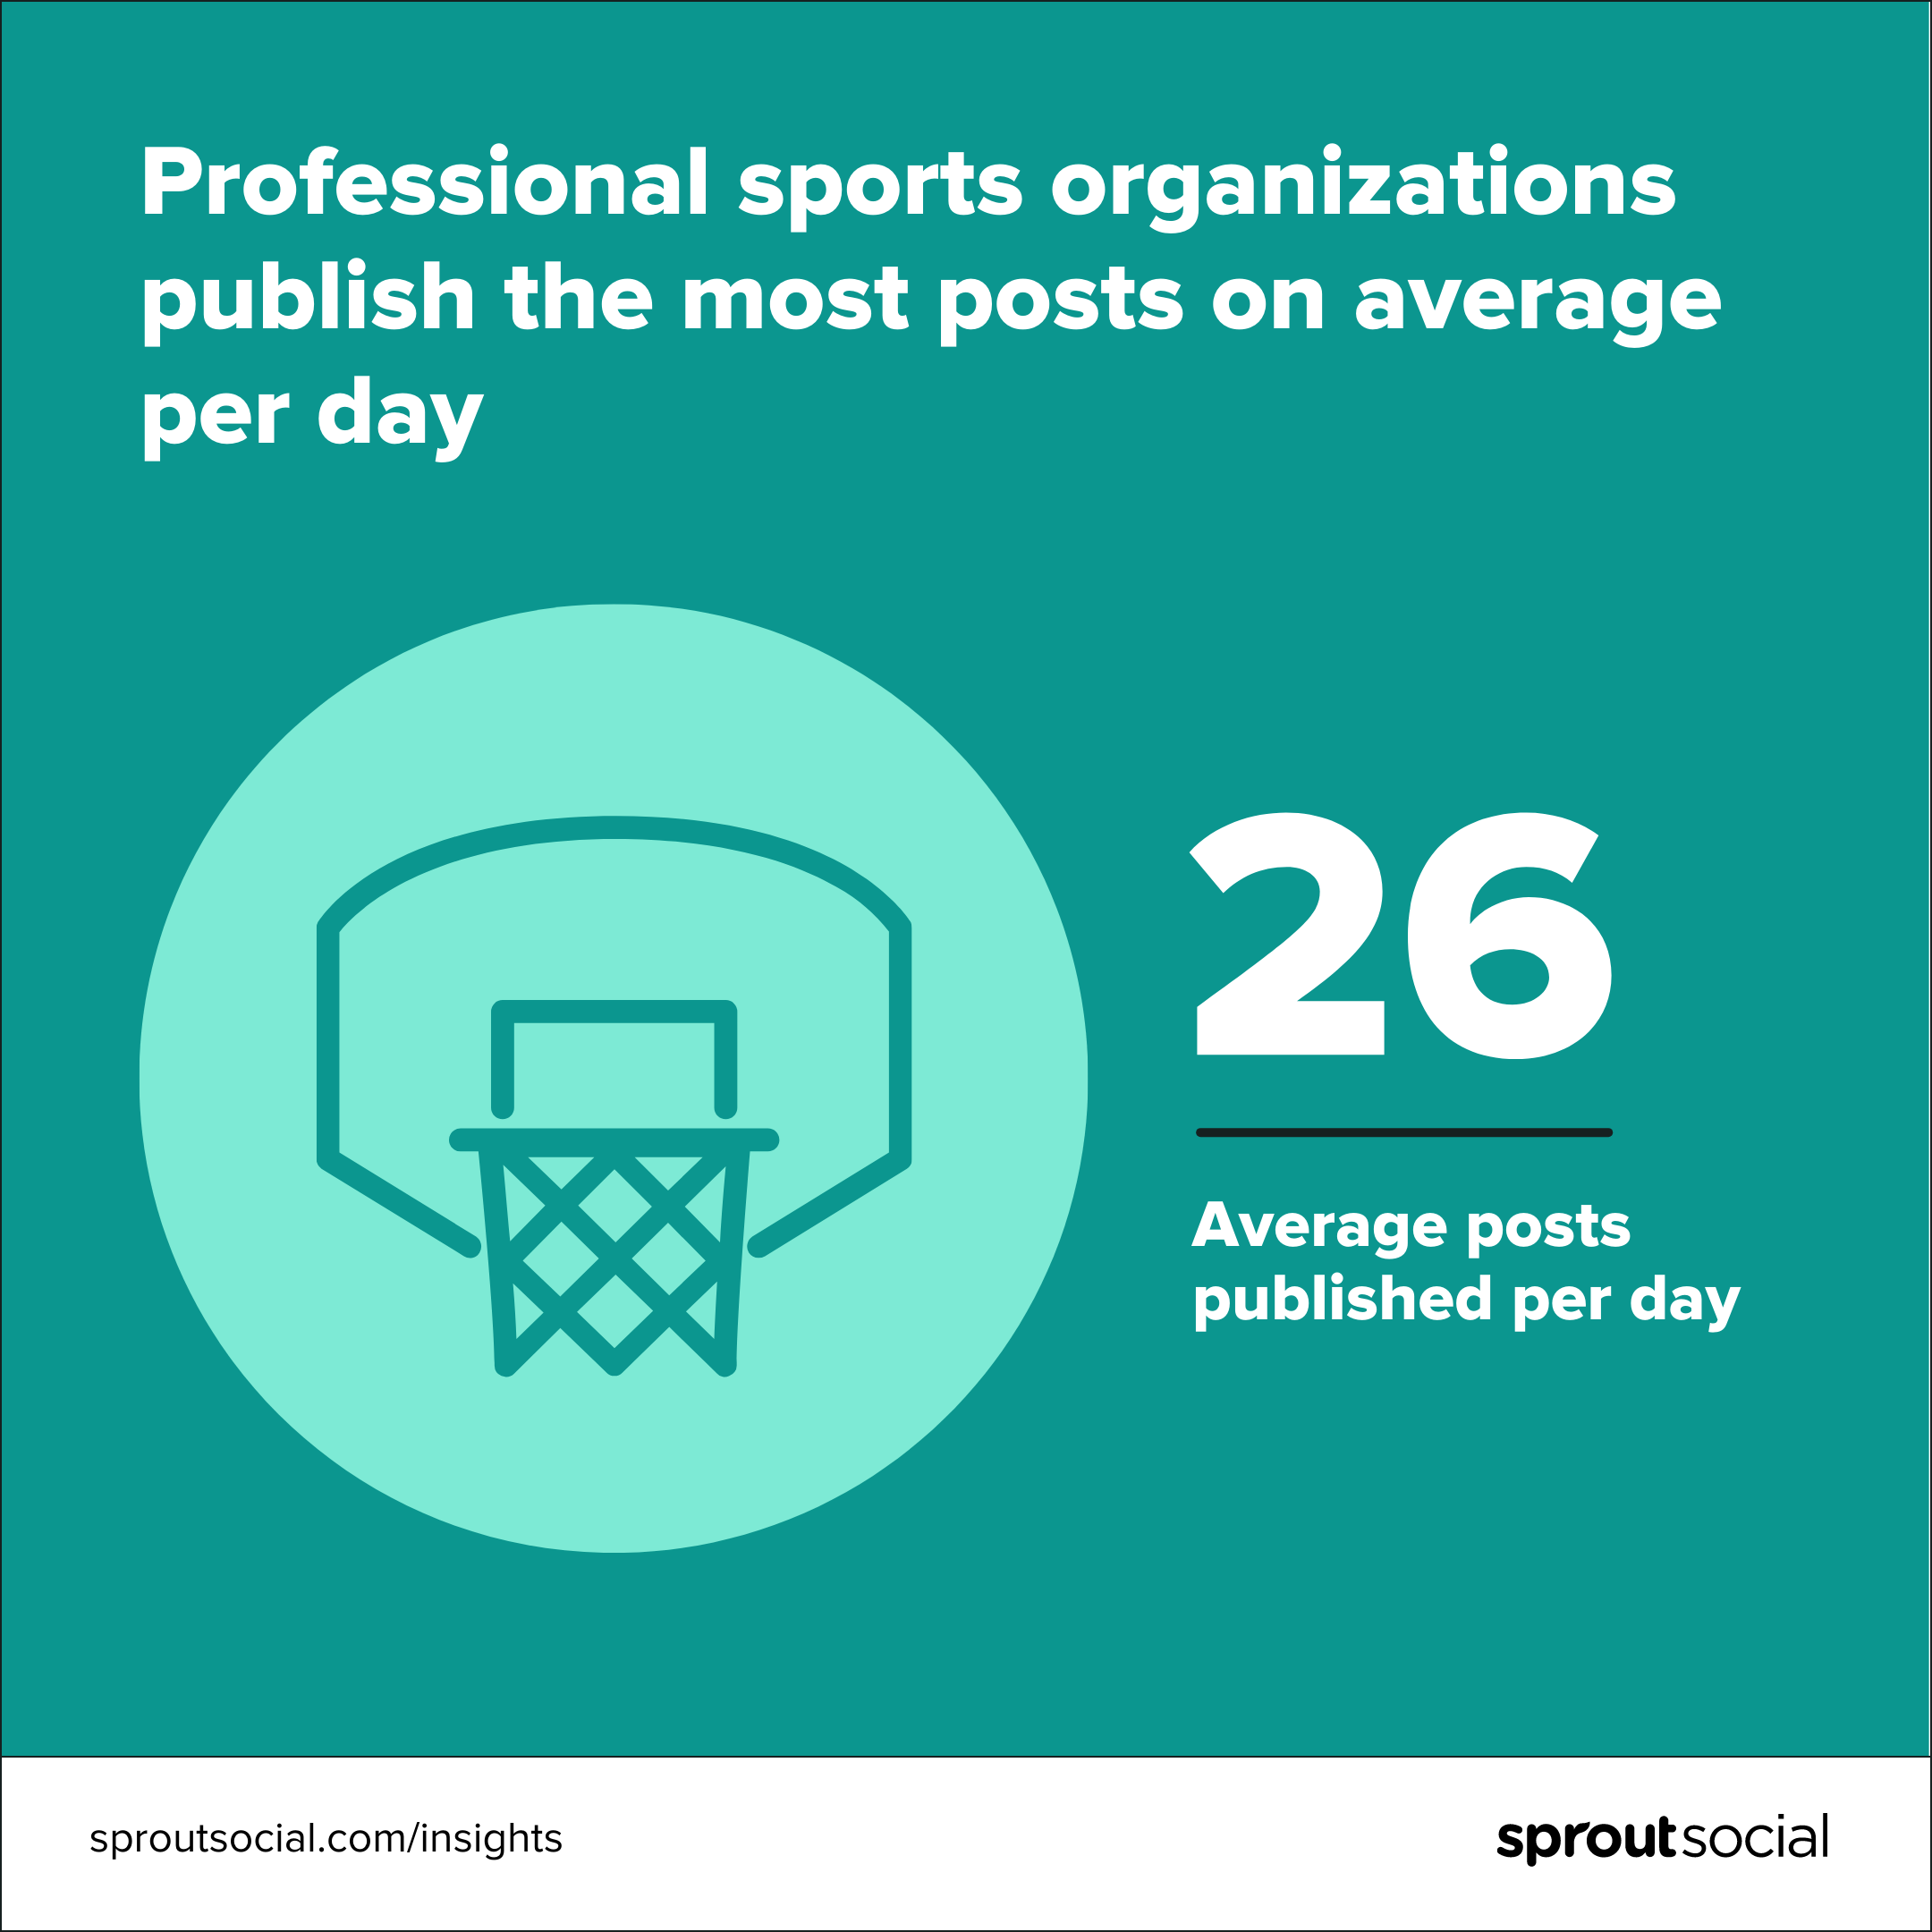
In 2022, professional sports organizations shared an average of 26 posts per day, making it the most prolific industry on social when it comes to sharing content.
To be fair, this industry has an edge over the rest. Social content can be sourced from fans, videographers, photographers and—if you’re working with a social-savvy team like the Cleveland Browns—even players.

You can still replicate this strategy even if you’re not a major sports team. Next time your business has something fun on the calendar, look at the event through a social-first lens to get more mileage out of your presence.
Inbound engagements
In this report, you’ll find two different inbound social media engagement benchmarks: average inbound engagements on content per day and average daily inbound engagements per post.
Breaking these numbers down by day and post helps validate the success of your overall strategy and individual posts. This granularity is key to measuring the success of big swings in your social creative and copy.
However, a swell of engagement isn’t always a good thing. In the best-case scenario, a surge in comments could mean that a post is sparking conversation. It could also mean that a crisis is taking place, and customers are reaching out on social media for support.
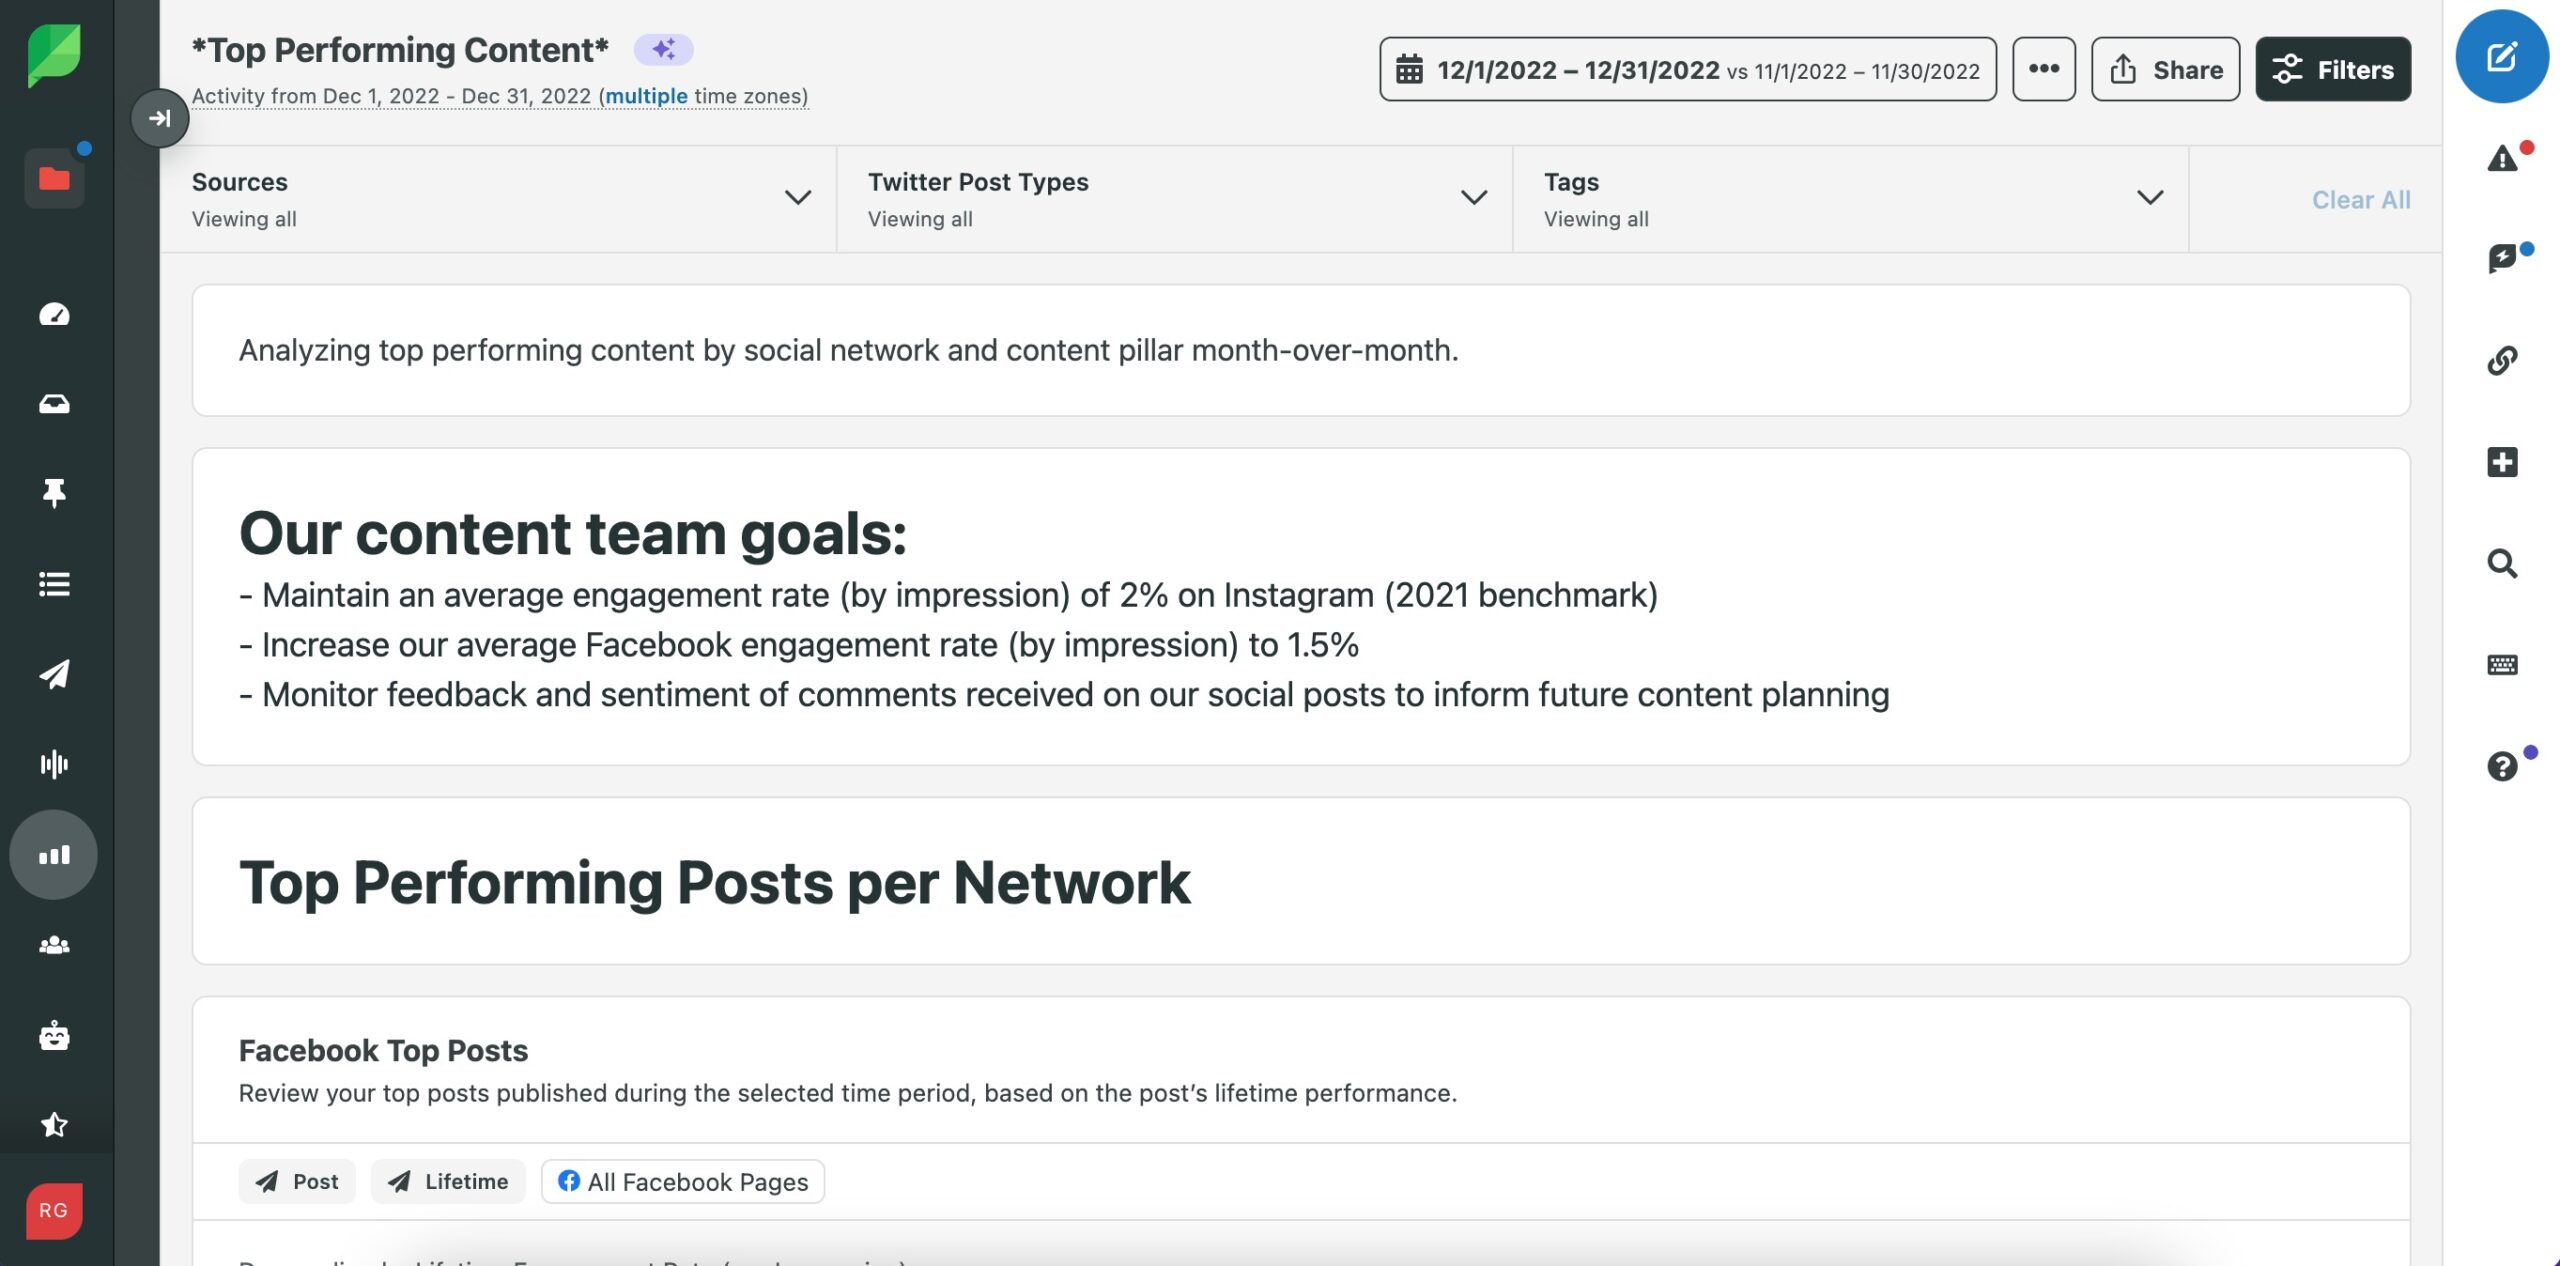
When creating social media reports, be sure to provide the necessary context around engagement spikes and dips. Use Sprout’s Custom Report Builder, you can embed performance details directly in your social performance dashboard using a Text Asset widget.
This all contributes to a more audience-centric understanding of what makes an effective social presence. Having this data at the ready can help you become more intentional about the individual posts that make up your strategy. It can also help you politely refute any pesky “just post this” requests.
Outbound engagements
In 2023, outbound engagements will make or break your social strategy.
People are flocking to closed communities and vertical networks for a more tailored online experience. To remain competitive in this new era of social, brands will have to double down on proactive marketing. Building 1:1 relationships on social isn’t a trick for overnight growth, but it is a controllable, sustainable path toward long-term rewards.
This marks a sizable shift in traditional brand social strategies. In 2022, the average number of outbound engagements was just 2 per day across all industries, with just 5 out of the 19 industries analyzed reaching an average of 4 or more.
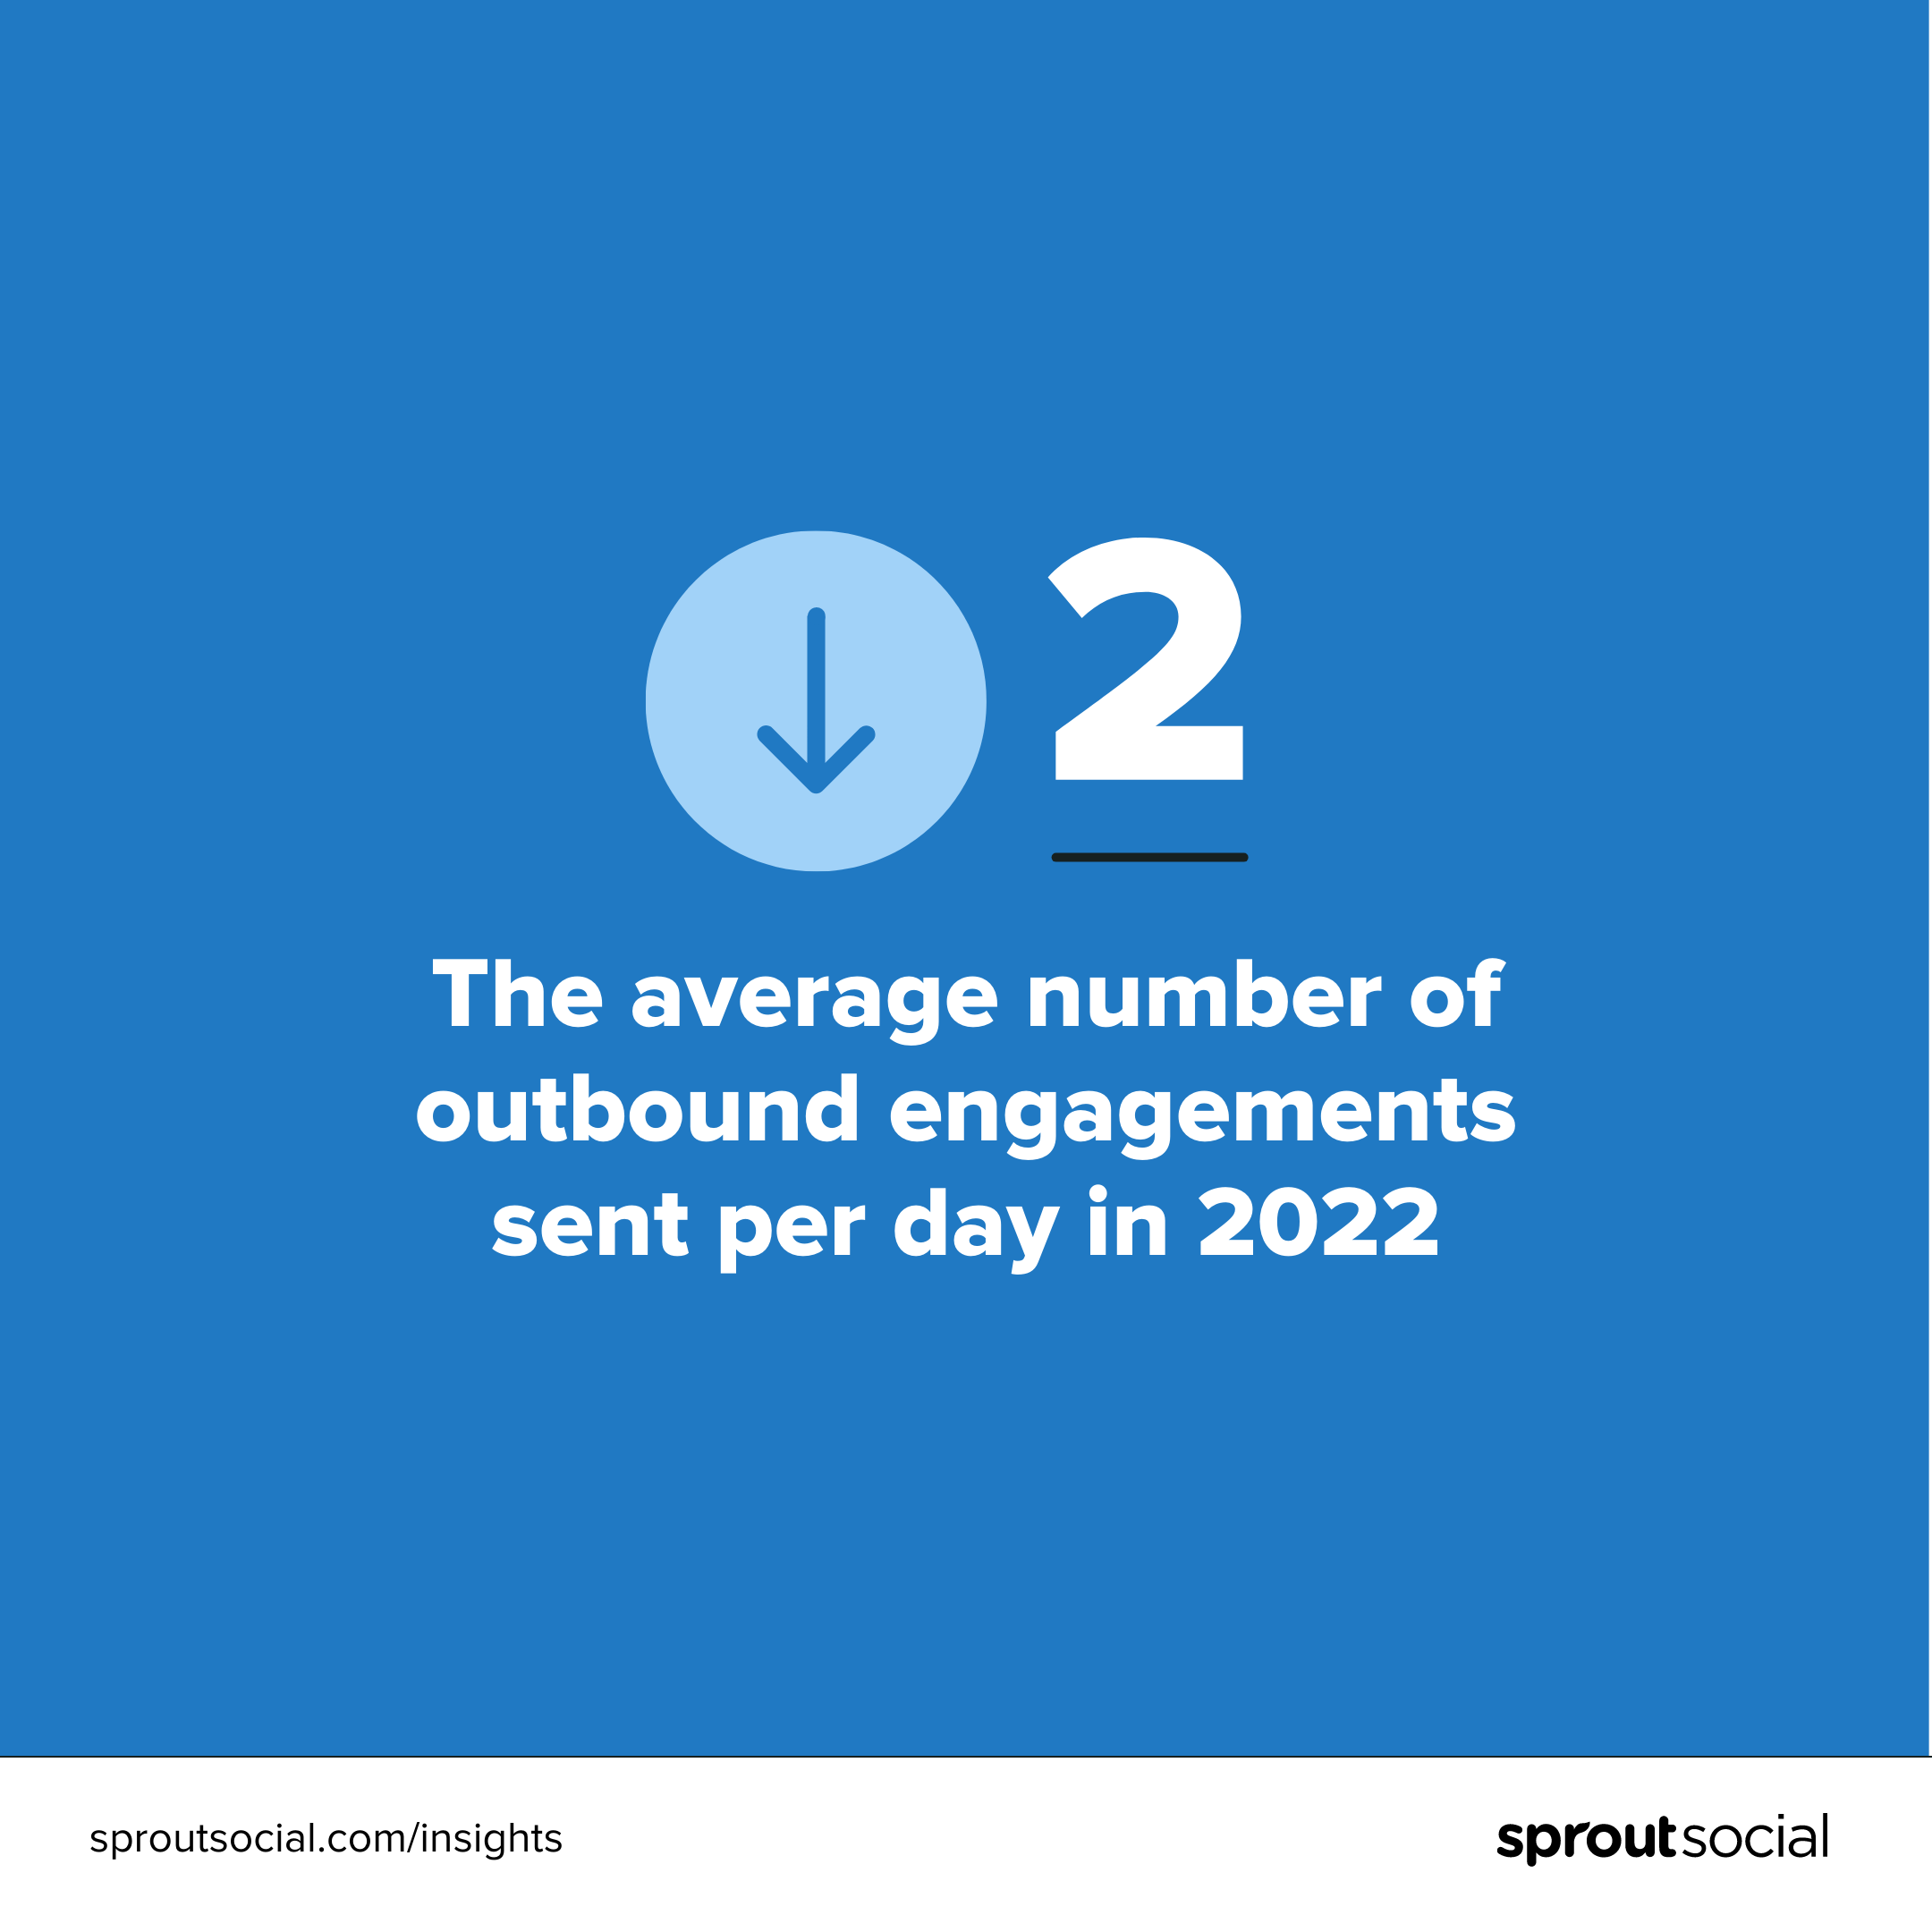
The good news? These numbers suggest that outbound engagement will be a surefire way to outpace your competition over the next 12 months and beyond.
As you plan your social media content calendar, leave placeholders for proactive engagement opportunities. Jump into the conversations that matter to your audience, whether that be at the industry or cultural level. It’s unexpected, which is what makes it so effective.
Social media benchmarking across social networks
How much time does your brand dedicate to each social platform? If you’re still trying to figure out how frequently you should be posting, commenting and engaging, these social media benchmarks can help you set the pace.
Facebook benchmarks
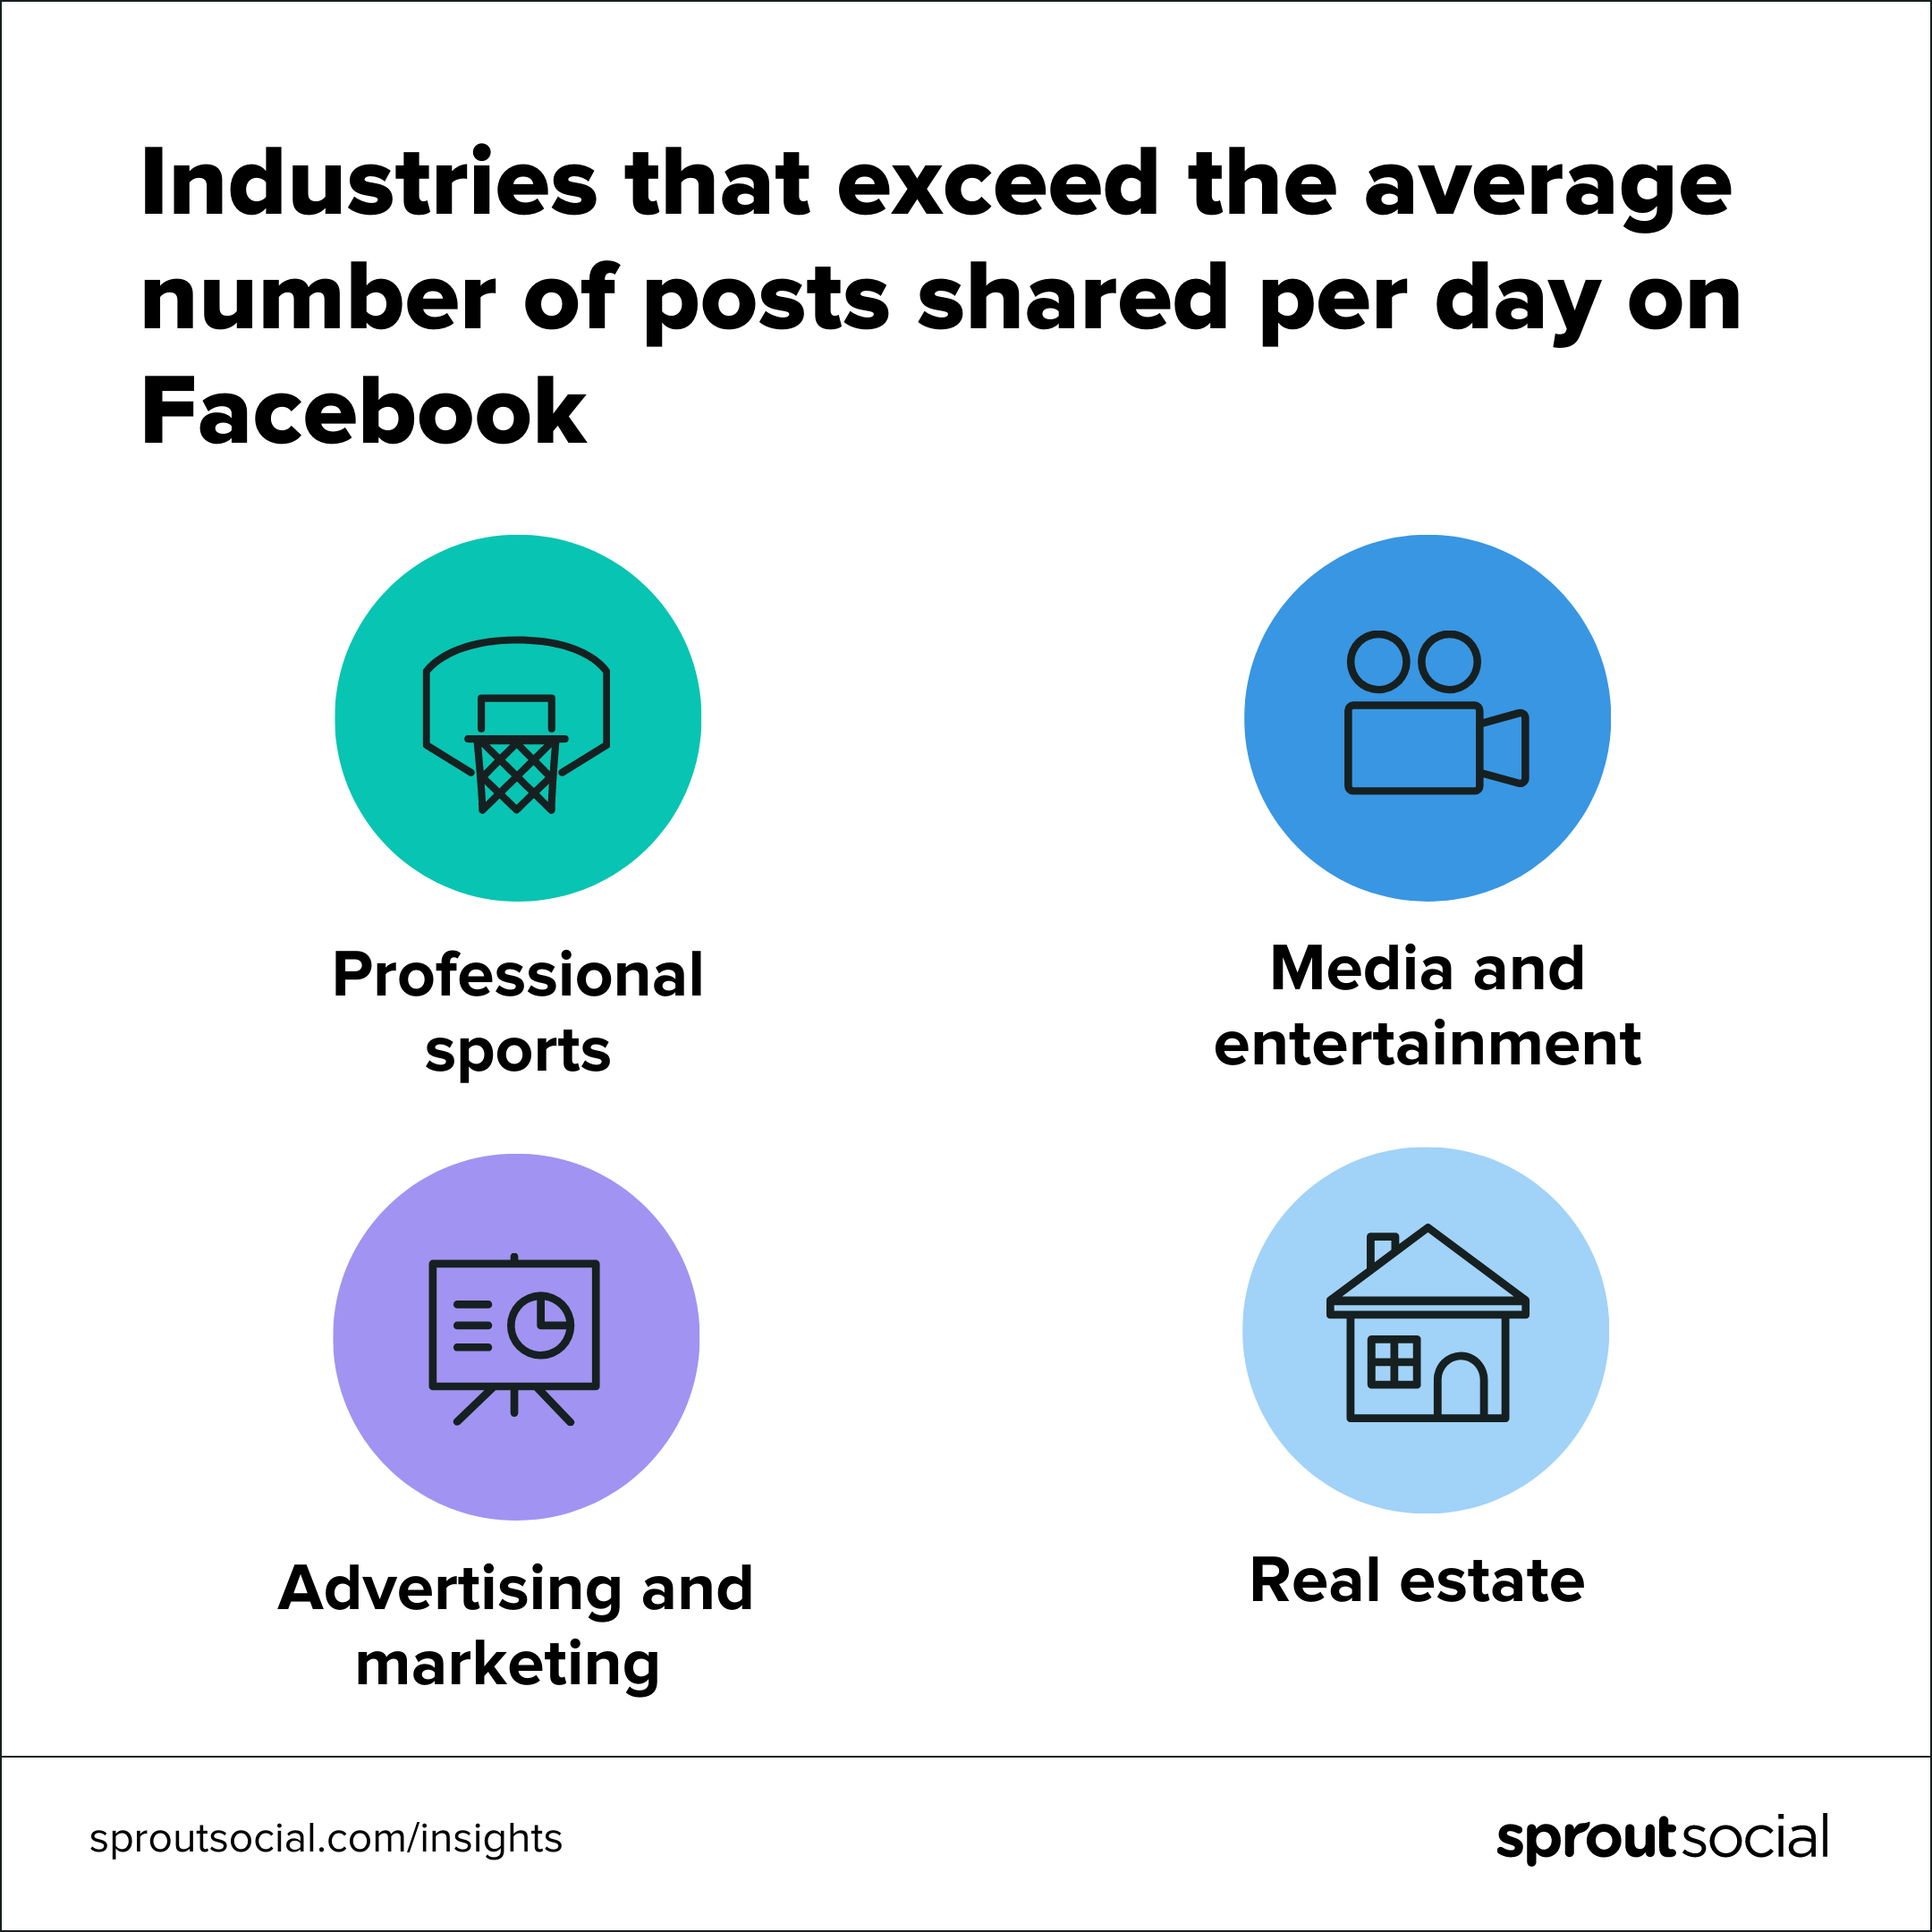
Across all industries, brands publish an average of 5 Facebook posts per day. The sectors that go furthest beyond this average include professional sports (9), media/entertainment (8) and advertising/marketing (8).
When it comes to engagement, brands receive an average of 28 comments and 7 direct messages per day on the network. Professional sports organizations and media companies welcome the most comments per day, which makes sense considering their frequent posting on the network.
Alternatively, companies in the travel and tourism industry receive 36 comments per day despite maintaining an average posting volume (5). This volume shows the value of monitoring your social inbox, regardless of whether a specific network is a focus on your social content calendar.
Instagram benchmarks
The total number of Instagram posts per day has taken a dip in recent years, suggesting that brands are favoring Stories over traditional grid posts. In 2022, brands only published once per day on average on the network.
There are, of course, some outliers. Industries that are likely to post more often include professional sports (3), retail (2) and consumer products (2).
While brands may post more infrequently, their fans are more active than ever. The average brand is tagged in five photos and four captions per day. If your social media strategy relies on user-generated content, then Instagram is the place to be.
Data shows that consumers are also favoring Instagram Direct Messages to get in contact with their favorite companies. Brands receive 27 Instagram DMs per day on average. Industries that exceed that average include travel and tourism (36), health and wellness (30) and internet and technology (29).
Twitter benchmarks
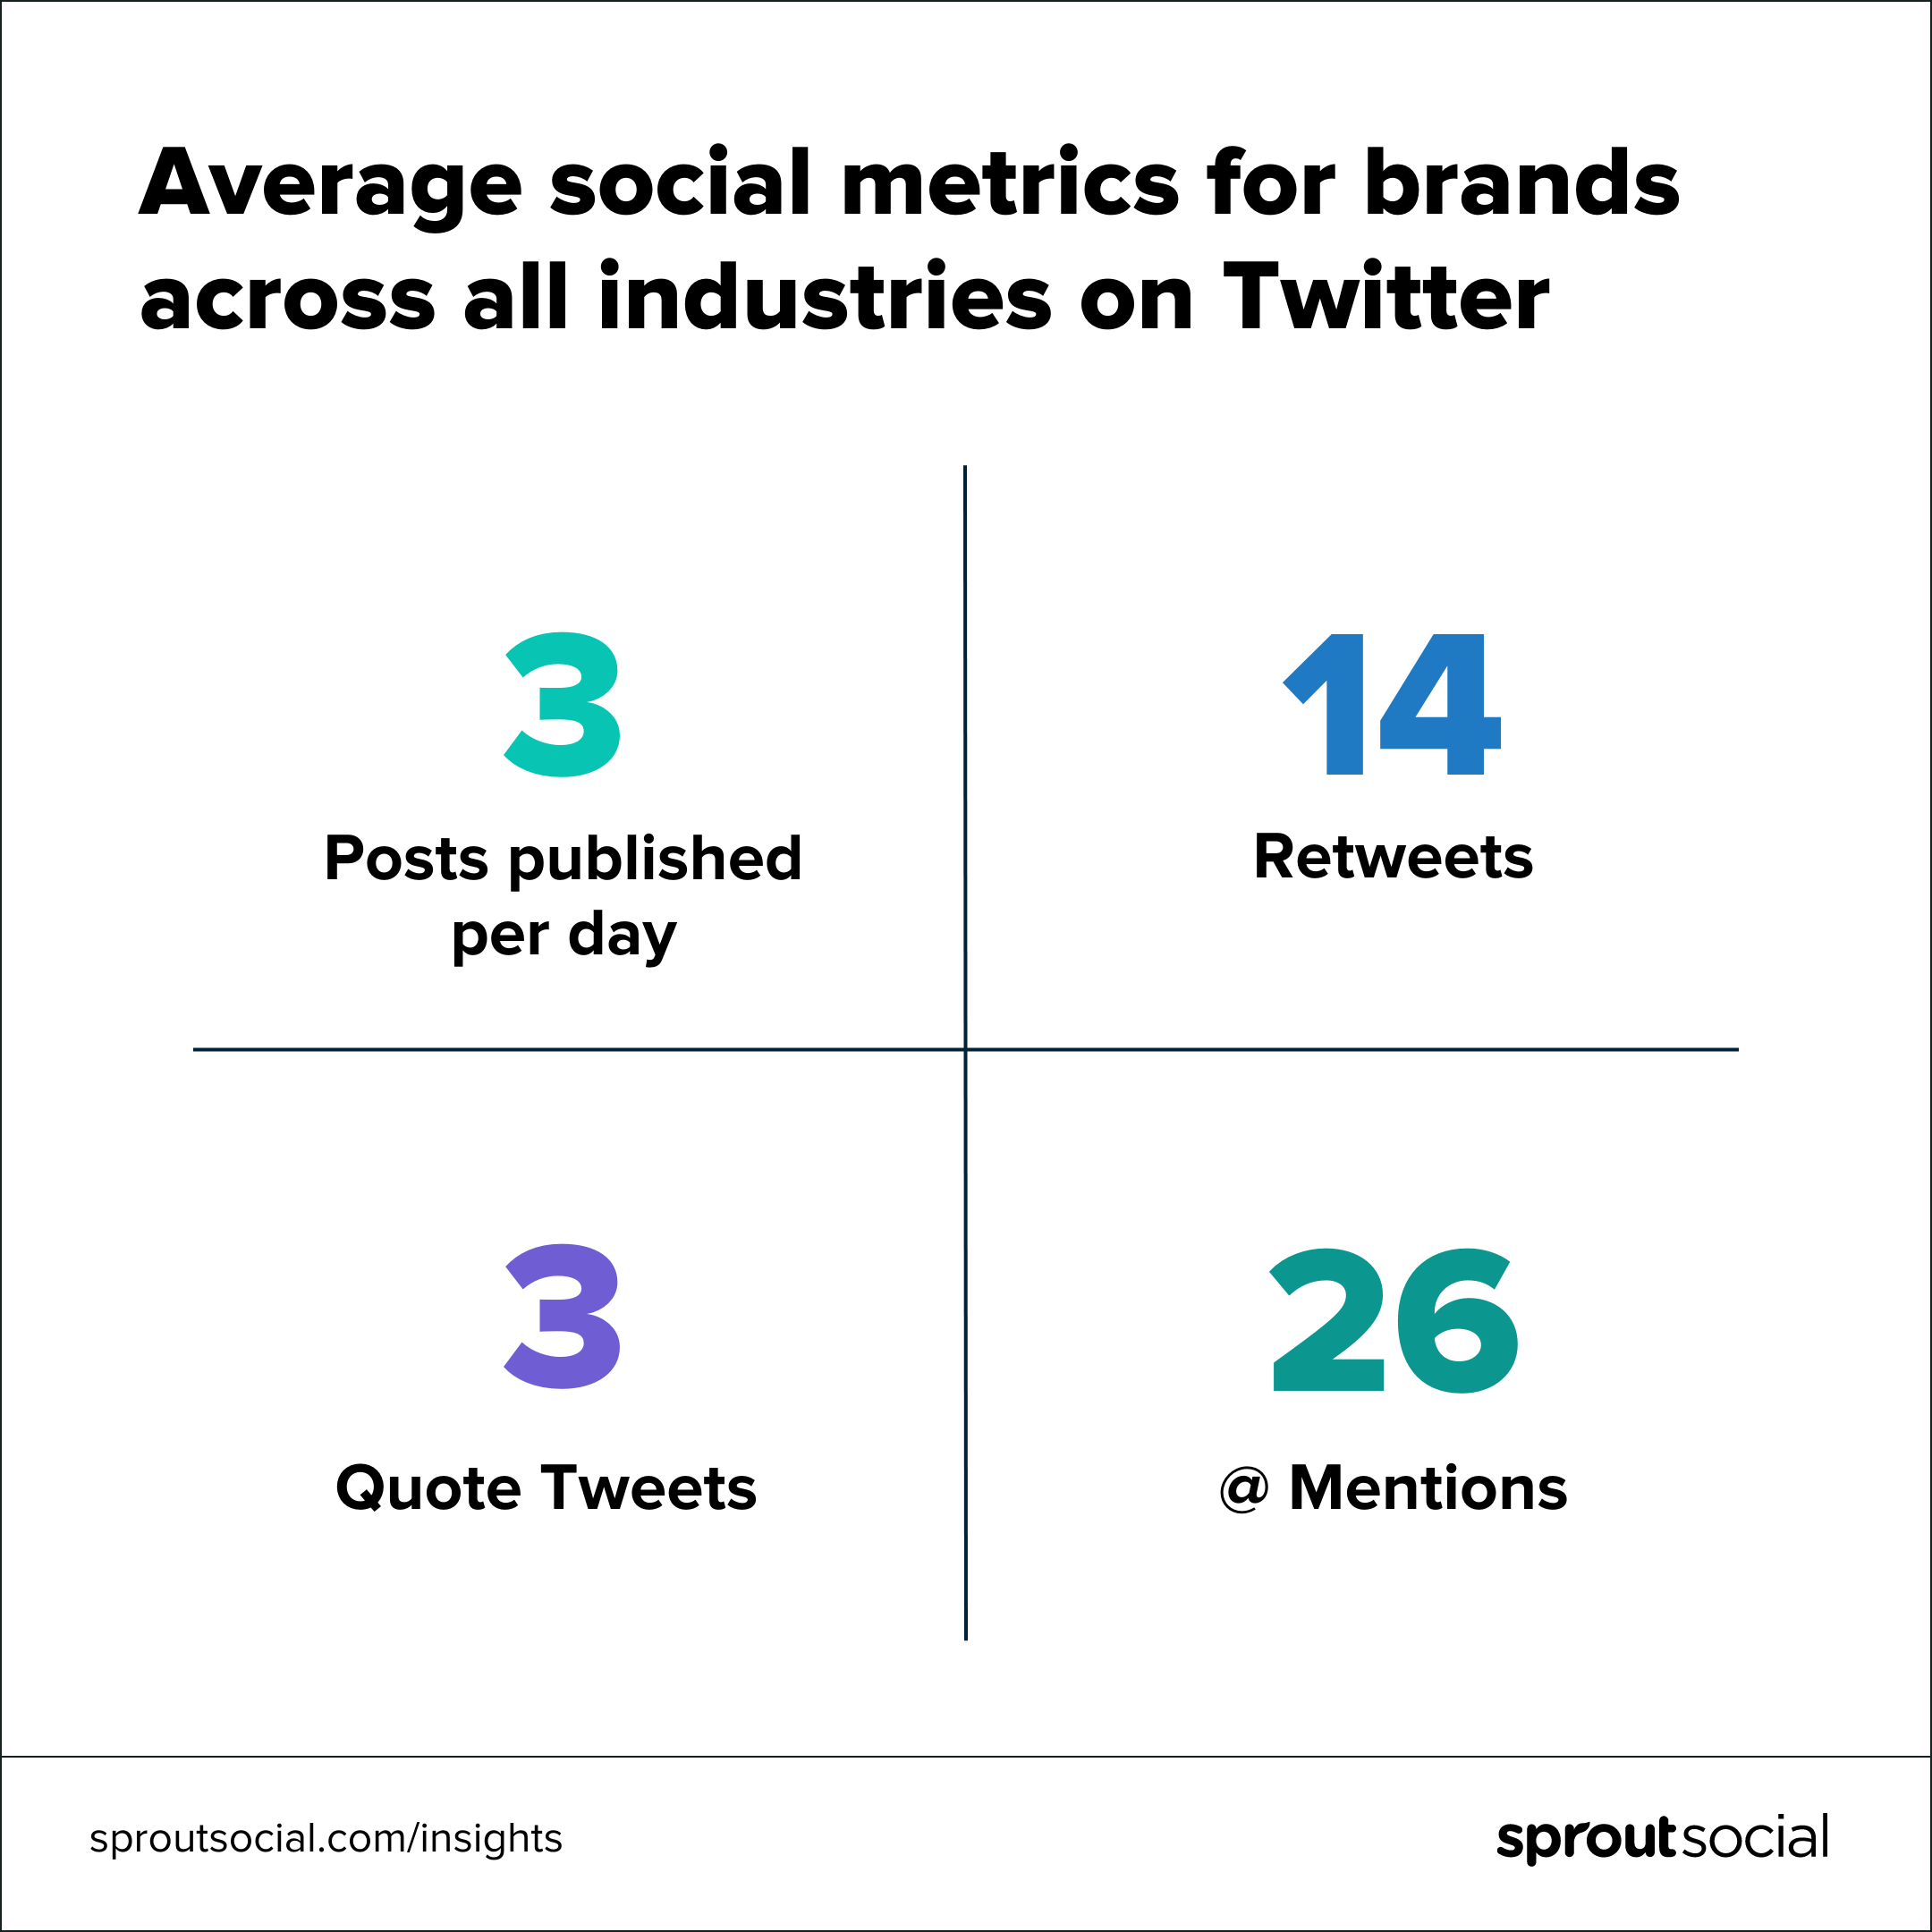
On Twitter, brands across industries send an average of 3 posts per day. Sectors posting more than this average include professional sports (13) and advertising/marketing (6).
Twitter offers multiple unique avenues for engagement. Quote Tweets and Retweets can be a way for audience members to boost brand content while making their own contributions to the conversation.
Across all industries, brands received an average of 14 Retweets and 3 Quote Tweets per day. Industries receiving a higher number of Retweets than average were professional sports (109), media and entertainment (35), and nonprofit (15). Industries with a lower-than-average number of Retweets were automotive (3), staffing and recruiting (2), and real estate (1).
On Twitter, @mentions allow brands and audiences to engage publicly on the feed. On top of that, audiences regularly use Twitter DMs for more extended conversations, such as customer care requests. Our research shows that brands receive an average of 26 @mentions and 2 DMs daily on the network.
Benefits of social media engagement benchmarks
Benchmarks can turn last year’s data into this year’s advantage. Now that you have new insights at your fingertips, here are three ways you can use social media engagement benchmarks to level up your strategy:
1. Industry benchmarks serve as inspiration
Every industry has its own unique approach to social media. If you want to revamp your social media marketing strategy, looking beyond your competitors can be the first step to your next game-changing campaign.
Use industry benchmarks to find out which brands outpace the rest when it comes to the metrics listed above. As you look through their social presences, try to identify what they’re doing differently and how your brand can emulate them. This is a great way to come up with innovative ideas that bring something new to your target audience.
2. Competitive benchmarks give your performance context
Understanding how your brand stacks up against competitors can help you tell a richer story with your performance data. With competitive benchmarking, you can better translate your efforts for business stakeholders who may not know what social media success looks like.
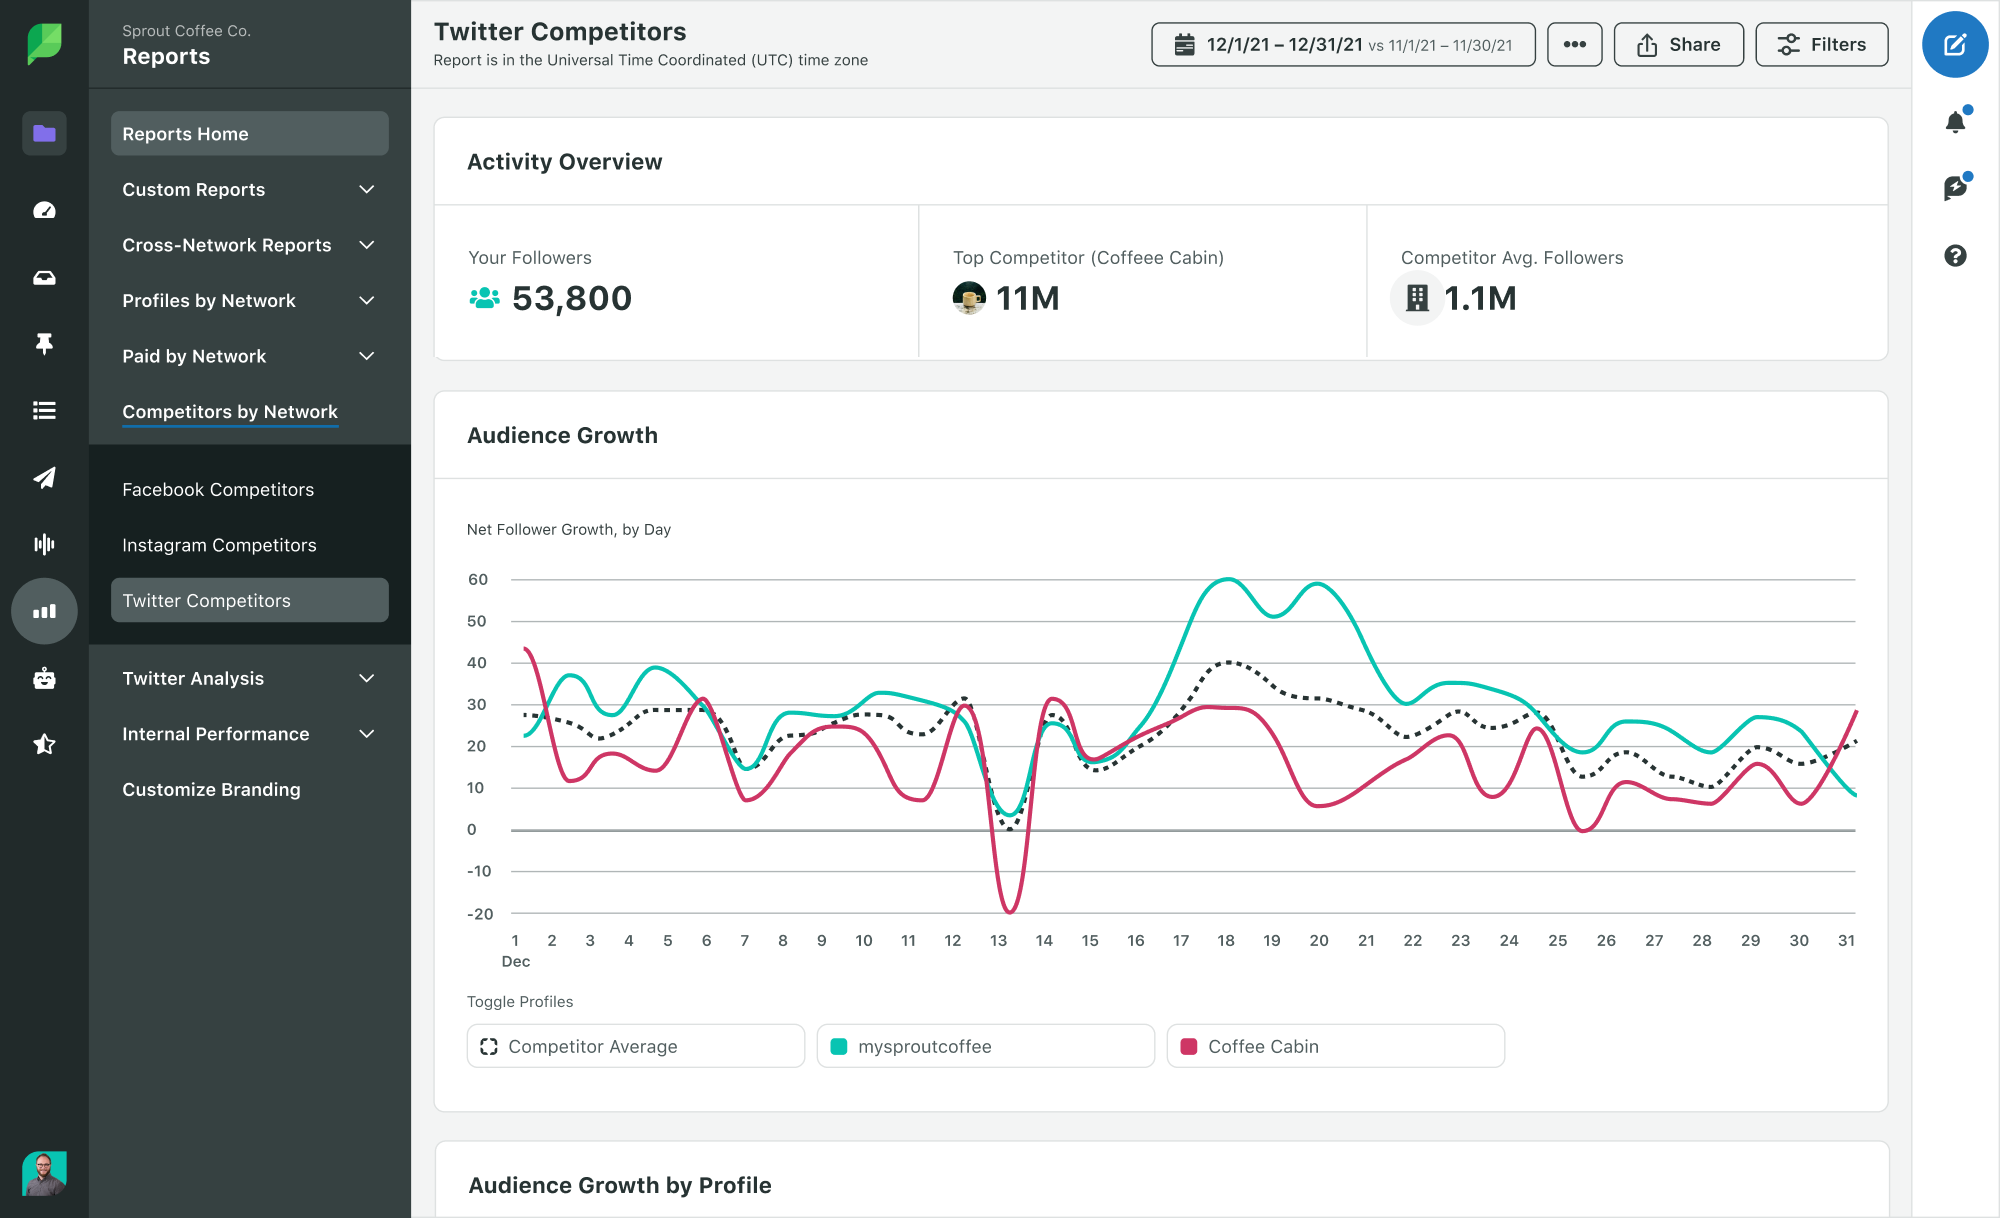
With Sprout, you can use network-specific competitor reports to compare your performance with your top business rivals. These social competitive analysis reports offer insights on publishing behavior, fan growth and engagement so you create tailored benchmarks around the metrics that matter.
3. Personal benchmarks inform your immediate goals
Your personal benchmarks should be your go-to resource for creating actionable goals. While industry social media benchmarks can give your performance color, your brand’s own year-over-year benchmarks tell the story of your growth over time.
This is especially meaningful for brands piloting new social strategies or adopting a new network presence.
Establishing personal benchmark data starts with annual reports. Your year-over-year performance data is critical to identifying strengths and weaknesses in your social media strategy. These insights should be the core reasoning behind your goals for the upcoming year.
Month-over-month benchmarks, on the other hand, will help you gauge progress on specific campaigns so you can identify quick wins or necessary pivots. These benchmarks will also help ensure that you’re pacing well on social media KPIs.
To gather the data needed for these reports, identify the metrics that matter most to your brand and create a spreadsheet to track how they’re pacing by month. Eventually, you’ll collect enough data to inform annual benchmarks.
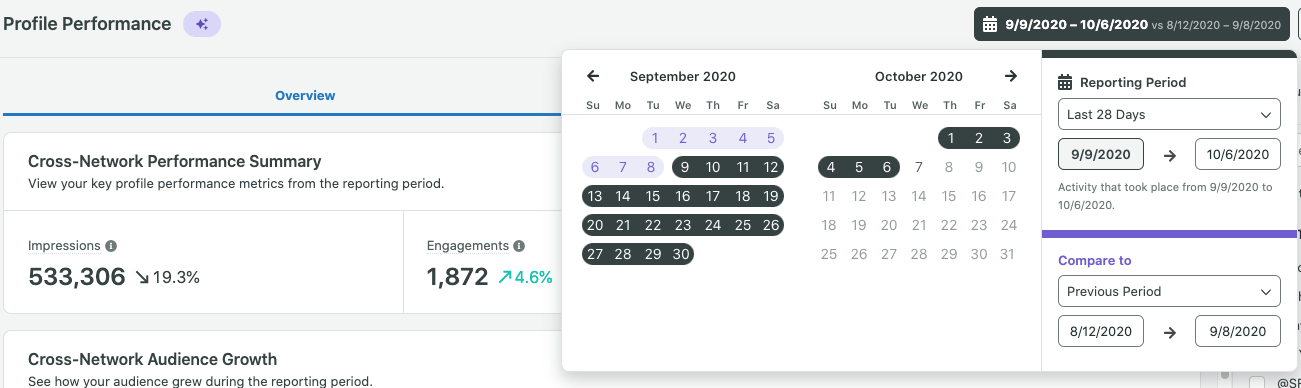
However, If you want to collect benchmark data on the fly, brands using Spout’s Premium Analytics can set custom date range comparisons to see how specific metrics are trending month-over-month, quarter-over-quarter and year-over-year.
Let your social media benchmarks guide the way
Now that you know where to start with industry, competitive and personal benchmarks, you have everything you need to optimize your strategy for maximum success.
Once you have your key objectives in place, you can take this interactive content mix assessment. The quiz will provide a visual breakdown on the themes that should be your top priority, depending on your goals.
The post Social media benchmarks by industry in 2023 appeared first on Sprout Social.