Earlier this week we posted a detailed breakdown on how we’ve been performance testing WPMU DEV managed WordPress hosting against our primary competition.
In this post we’re going to share with you exactly how each host did.
And usually, whoever does these comparisons, wins them, right?
Well, not this time (ooooo!)……….
Here’s a quick recap of the hosting testing methodology we used, that you can replicate, for free, at home.
Basically, we…
- Took our top 8 hosting competitors based off general popularity and our members hosting usage, and tested the performance of their base managed WordPress plan versus ours, specifically: GoDaddy, Flywheel, WP Engine, Cloudways, SiteGround, BlueHost, Kinsta, and HostGator.
- Made an account with each host at their entry level (base) managed WordPress plan (apart from Cloudways as they don’t do managed WP) and created the same exact test website on each platform.
- Ran each host through a rigorous load test (to see how many users they can handle at the same time) using the awesome and freely available Loader.io – you can go run your own tests right now to see how you do.
- Put each hosts speed and Time To First Byte (TTFB) to the test with the equally free KeyCDN’s performance testing tool – again, go check it out and test your own host.
- Established how many parallel clients (read: users visiting the site at the same time) each host could take.
- Worked out TTFB in what we think is the fairest way (as they can vary dramatically based on server location): TTFB Average (Geo-Optimized), TTFB Average (All Locations).
- Did all this without implementing caching of CDNs, so you get to test the actual server in real dynamic conditions (much more on that decision in our methodology post, tl;dr you can put any host behind a great CDN and serve static pages like a gun, but WP isn’t about that… although we are open to adding that as a test too.)
Alright, now you’re all caught up, let’s not delay any further.

Here’s how our base plan fared against some of the most popular managed WordPress hosting providers on the web:
The raw results:
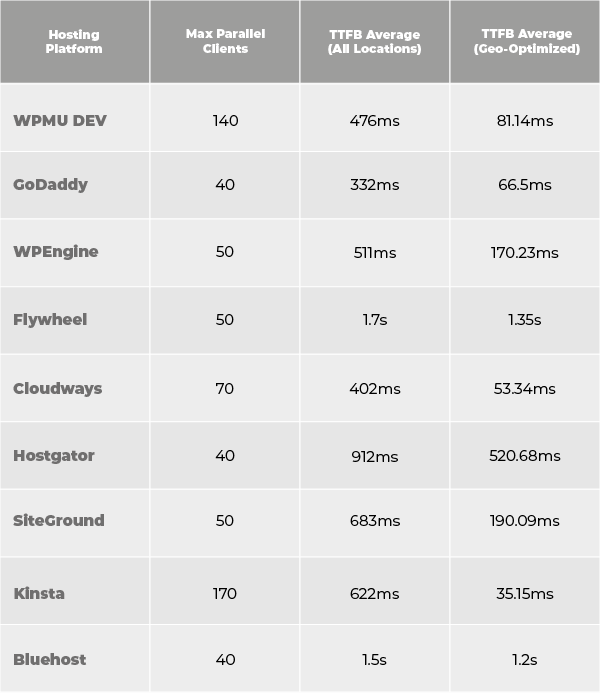
How each host ranked in each category:
Max Parallel Clients (how many users the host can handle at once)
1.Kinsta – 170
2.WPMU DEV – 140
3.Cloudways – 70
4.WP Engine – 50
4.Flywheel – 50
4.SiteGround – 50
5.Bluehost – 40
5.GoDaddy – 40
5.HostGator – 40
TTFB Average (speed of server response averaged across the globe)
1.GoDaddy – 332ms
2.Cloudways – 402ms
3.WPMU DEV – 476ms
4.WP Engine – 511ms
5.Kinsta – 622ms
6.SiteGround – 683ms
7.HostGator – 912ms
8.Bluehost – 1.5s
9.Flywheel – 1.7s
TTFB Best (the fastest response recorded, we assume this is down to geolocation)
1.Kinsta – 35.15ms
2.Cloudways – 53.34ms
3.GoDaddy – 66.5ms
4.WPMU DEV – 81.14ms
5.WP Engine – 170.23ms
6.SiteGround – 190.09ms
7.HostGator – 520.68ms
8.Bluehost – 1.2s
9.Flywheel – 1.35s
A quick summary of the results…
When it came to the maximum number of parallel clients each server handled during the load test, Kinsta came out on top with 170 concurrent users – followed closely by us with 140.
As we touched on in our methodology post, these hosts are the ones (metaphorically) letting the most people into the bar at the same time thanks to their higher parallel client numbers.
So that’s great work by Kinsta, being able to cope with that many users visiting your site on your base plan is pretty impressive, although we’re pretty chuffed about our second place.
In terms of speed, Kinsta also took out the TTFB (Geo-Optimized) category with the speediest TTFB time (35.15ms) of them all… we’re betting that KeyCDN and their servers are not all that far apart.
And lastly, the TTFB Average (All Locations) crown went to GoDaddy, with an average TTFB time of 332ms over the 10 locations that KeyCDN accounted for. Nice work to the big GD!
We came 3rd and 4th respectively in both TTFB categories, which we’re pretty happy about.
Of course, we do offer a selection of geolocation options on our base plan. So if you value speed in, say, the US East Coast ,or the UK, or Germany the most – we should hopefully win that for you with our geolocated servers.
Taking price into consideration…
If cost wasn’t an issue and we had to pick an overall winner from the testing, it would have to be Kinsta, as they took home first place in two of the three hosting performance categories. Nice work Kinsta!
But, of course, if we’re comparing apples with apples we have to also look at pricing. Which, handily, we include below:
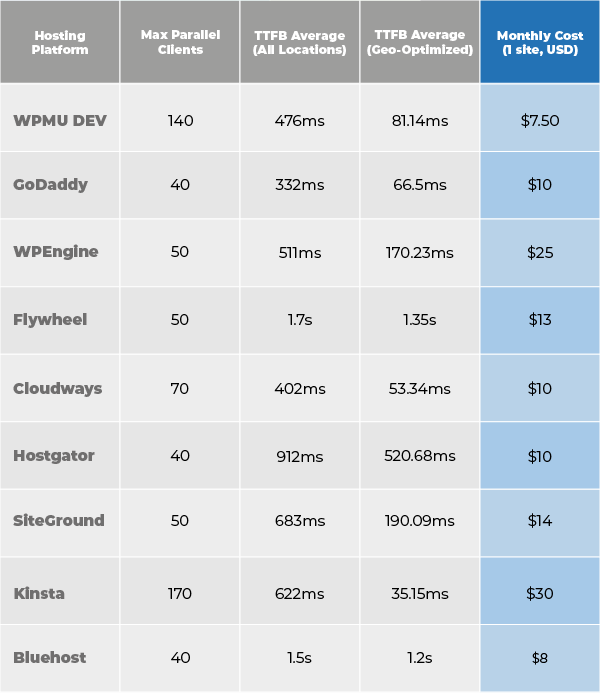
A few notes on the pricing:
- It’s accurate as of September 2020.
- All prices are in USD and retrieved via US VPN in incognito.
- We’re only listing renewal prices (no initial discounts or multi-year lock-ins) but we are including annual discounts.
- We’ve rounded up .99 (GoDaddy & BlueHost) and .95 (HostGator).
- Cloudways is not a managed WP platform but is included due to our members usage, so site limits don’t apply, we’re choosing Digital Ocean with them.
So… how does WPMU DEV hosting rate now?
Considering the cost, we’d like to think that we offer the best value for money in terms of performance and load.
While Kinsta is obviously great choice for high performance on their base plan, you’d have to realistically test them against our silver or gold plans ($18.75 and $37.50 respectively) if you’re looking at a fair comparison.
GoDaddy is clearly fast (their CDN is great too btw) but we reckon we’ve given them a good run for their money.
But probably, after all this, we’d say that the host that’s most comparable with us is Cloudways because, well, we use the same partner (Digital Ocean) and as you can see we rank very similarly.
A big advantage for some users for Cloudways would be that you can install as many applications as you like on a Digital Ocean platform, whereas with us you just get the 1 WordPress site. However, that has enabled us to build a stack that vastly outperforms them when it comes to load testing.
Overall though, we’d say that either our hosting or Cloudways is probably your best bet based on these tests… although you could do a lot worse than using Kinsta or GoDaddy.
Our take on how WPMU DEV Hosting did.

Overall, we were really pleased with how WPMU DEV Hosting fared against the competition.
But that doesn’t mean that we can’t do better. In fact it’s energized us to try harder and get you better results.
Specifically we’d like to improve:
- Our pricing… we’re working to offer you an even more affordable plan that delivers similar results (and better than our competitors).
- Our TTFB… we’re adding new locations as I type this (Australia we’re coming for ya soon) that should improve our overall speed.
- Our overall offering… in addition to all of the above, we’re hoping to provide you, by the end of the year, a managed WP platform for free on top of this.
As amazing as it would have been to take out first place and rule everything, in the grand scheme of things, we’re still new to hosting (just over a year old in fact!), and to already be up there with the best in the biz feels great, and we’re excited about doing better.
Some other key takeaways from this host performance testing experience:
- We feel like a lot of hosts rely too heavily on caching or CDN mechanisms to save them, but that they give you an unrealistic feel for the capacity of your hosting in a genuine and dynamic sense… anyone can serve a static html page to a bazillion visitors.
- TTFB is hard to measure fairly, it’d be great if more hosts let us know *where* they were hosting you for their base plan.
- We reckon the number of clients your server can handle is MORE important than the speed at which you’re serving them. Back to our bar analogy: Would you rather server 140 people in a timely manner? Or serve 40 at a slightly faster pace before 41 enters, and you’re forced to close and deny more potential customers?
Check out the full comparisons of each host vs. WPMU DEV Hosting.

As touched on earlier, when comparing hosts it’s important to take EVERYTHING into account, not just performance.
So at the same time as running these performance tests, we also put together some insightful hosting comparison pages which square DEV hosting off against all the hosts mentioned above.
What’s great about these pages is that as well as the performance results, we’ve also included up to date feature and cost comparison tables you can use as reference.
That way you get a well-rounded idea of what host is going to suit you or your business best. So definitely check them out if you get a chance.
Let’s do this more often…
And that’s all there is to it.
We hope you’ve enjoyed this inside look at how we tested WPMU DEV Hosting.
Our team has taken a lot of valuable insights from this experience, and we hope you did too.
Anything you’d have us do differently? Were there some big hosting players we left off the list?
Let us know below.
The whole point of this process has been to be completely fair and transparent with all of our processes and findings. And if you think there’s a better (or fairer) way we could have tested, please let us know, we’re open to discussing anything and everything in the comments!
But in fact, you really don’t even have to take our word for it…
See how WPMU DEV Hosting performs for yourself.
If our findings have piqued your interest, feel free to run your own tests following our methodology (or any other you prefer).
Check out our hosting plans or take a WPMU DEV membership (Incl. 1 Bronze level site) for a free 7 day trial.
Want to test for longer than 7 days? Everything WPMU DEV comes with an automatic 30 day money-back guarantee.
Until the next round of hosting testing.
Source: premium.wpmudev.org