The life of an application can roughly be divided into two: everything that happens before it goes live – building, packaging, publication – and then, everything that happens after that milestone. Traditionally, on Linux, developers didn’t always have an easy way of deriving useful numbers on how their software was doing across the distrospace. Indeed, the ability to understand one’s audience’s needs, and then react to them, perhaps by improving a product, or making changes that would help grow the usage, is an important part of the software lifecycle. The question is, how (and if) can you do that with snaps?
Enter the Store
Last year, we had a pretty thorough overview of the Snap Store, and the different functionalities it offers to publishers. If you have an account, and you’ve published a snap or three, you can configure and modify a whole range of settings and options for your applications. For instance, you can upload screenshots and videos, add collaborators, trigger builds, publicize your work, and check the metrics.
By default, the metrics page displays a 30-day weekly active devices count, and a breakdown by application version. This gives you a good understanding of the overall behavior of the systems using snap. You can increase the window to get a longer view of the trends.
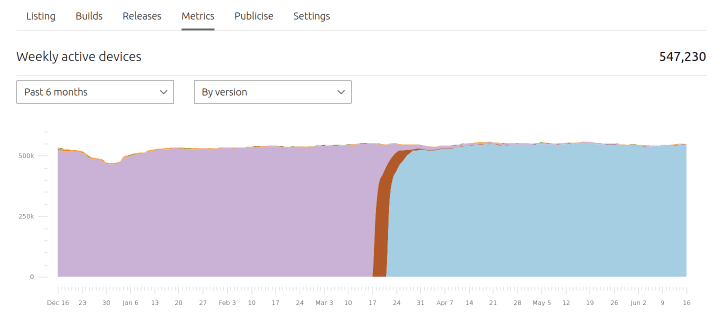
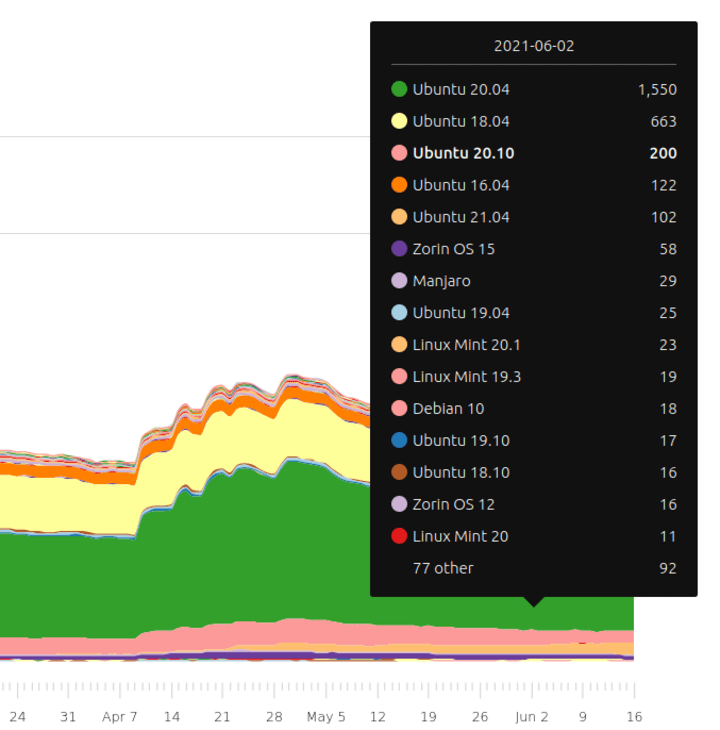
The timescale dropdown lets you go back up to 5 years. More interestingly, the second dropdown menu allows you to display your snap usage either by version, or by three additional qualifiers – operating system, channel, and architecture. The first is the breakdown of different Linux distributions on which your snap is installed and used.
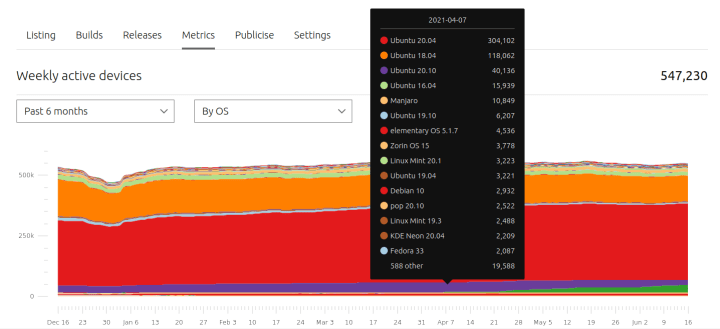
Hover the mouse cursor anywhere on the graph, and for that given date, you will see the breakdown of the snap usage per distro, including the specific release. For example, for the shown snap, around April this year, there were 300K active Ubuntu 20.04 devices, but also about 10K Manjaro systems, roughly 5K elementary OS 5.X systems, 3K Debian 10 users, etc. The list also includes almost 600 entries (by different version breakdown) covering about 20K other devices.
The information can also be useful for less popular snaps, with only a small usage pool. It can help developers or publishers only starting their application journey better understand their decisions, like marketing campaigns, feature inclusion, community engagements, and other vectors. For example, a publisher may discover that snaps (should) make it easier for their non-Ubuntu audience to find and install the application, which can then govern future choices. Lastly, it can help address the often common public perception that snaps are used exclusively on Ubuntu.
Summary
Metrics are a hot potato in the Linux world. But they can be useful, both to the publishers and the end user, without having to compromise on user privacy. The bulk division by distribution release, in addition to the raw numbers, available in the Snap Store provides application developers with good visibility of their work, their actions, and the sentiment in the community. In the end, this information can help produce better software and better user experience, one of the core goals and purposes of the cross-distro nature of snaps.
Photo by Mitchel Boot on Unsplash.