It’s been over a year and we are still fighting with the pandemic at almost every aspect of our life. Thanks to technology, we have various tools and mechanisms to track Covid-19 related metrics which help us make informed decisions. This introductory-level tutorial discusses developing one such tool at just Linux command-line, from scratch.
We will start with introducing the most important parts of the tool – the APIs and the commands. We will be using 2 APIs for our tool – COVID19 API and Quickchart API and 2 key commands – curl and jq. In simple terms, curl command is used for data transfer and jq command to process JSON data.
The complete tool can be broken down into 2 keys steps:
1. Fetching (GET request) data from the COVID19 API and piping the JSON output to jq so as to process out only global data (or similarly, country specific data).
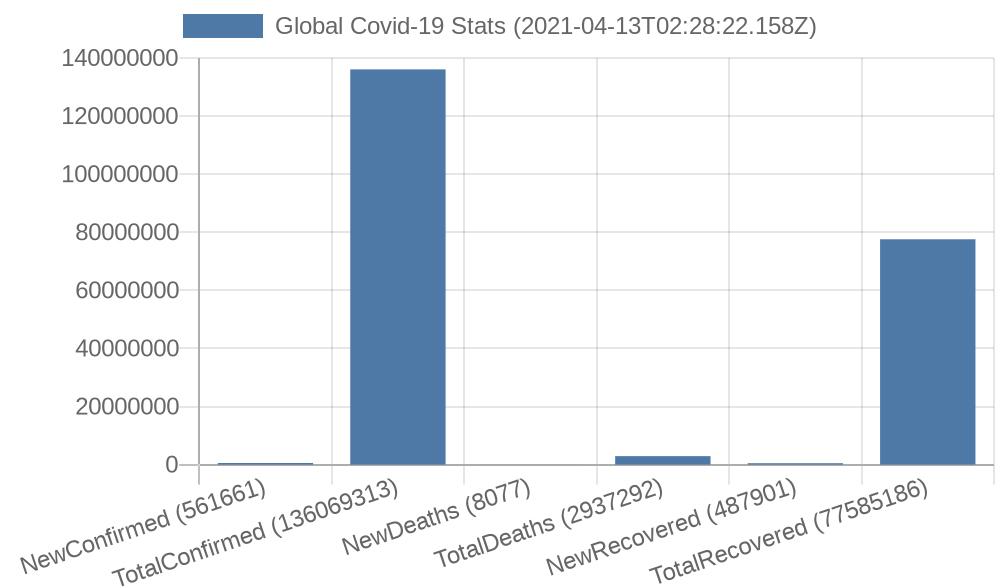
$ curl -s --location --request GET 'https://api.covid19api.com/summary' | jq -r '.Global' { "NewConfirmed": 561661, "TotalConfirmed": 136069313, "NewDeaths": 8077, "TotalDeaths": 2937292, "NewRecovered": 487901, "TotalRecovered": 77585186, "Date": "2021-04-13T02:28:22.158Z" }
2. Storing the output of step 1 in variables and calling the Quickchart API using those variables, to plot a chart. Subsequently piping the JSON output to jq so as to filter only the link to our chart.
$ curl -s -X POST -H 'Content-Type: application/json' -d '{"chart": {"type": "bar", "data": {"labels": ["NewConfirmed ('''${newConf}''')", "TotalConfirmed ('''${totConf}''')", "NewDeaths ('''${newDeath}''')", "TotalDeaths ('''${totDeath}''')", "NewRecovered ('''${newRecover}''')", "TotalRecovered ('''${totRecover}''')"], "datasets": [{"label": "Global Covid-19 Stats ('''${datetime}''')", "data": ['''${newConf}''', '''${totConf}''', '''${newDeath}''', '''${totDeath}''', '''${newRecover}''', '''${totRecover}''']}]}}}' https://quickchart.io/chart/create | jq -r '.url' https://quickchart.io/chart/render/zf-be27ef29-4495-4e9a-9180-dbf76f485eaf That’s it! Now we have our data plotted out in a chart: