Today we want to dive into how to better use and understand the data from the popular website speed test tool Pingdom. You can use it to do what we call a waterfall analysis of your WordPress website. This helps you more easily diagnose performance issues, and also not misdiagnose a problem. We see a lot of times that WordPress users are interpreting the data wrong in Pingdom speed test tool, and this leads them to sometimes configuring their site to a state that was even worse than before.
Knowing how @Pingdom works is priceless information for WordPress website owners! ?
Pingdom
Pingdom is a company based out of Sweden that offers uptime monitoring and web performance management services. Probably one of the things they are most well known for is their free website speed test tool. It is one of the most popular performance testing tools in the WordPress community. Why? Well, for one it is very easy to use! Not everyone is a web performance expert and so for the typical WordPress user, some of the other alternative tools out there can actually be quite overwhelming. Sometimes less is more as they say.
Pingdom website speed test
Pingdom allows you to test the website speed of any website from 5 different locations:
- Dallas, Texas, USA
- Melbourne, Australia
- New York City, New York, USA
- San Jose, California, USA
- Stockholm, Sweden
The physical location you choose is actually very important as it relates to where your website is actually hosted. But we will get into this in more detail below.
Waterfall Analysis with the Pingdom Speed Test Tool
A web page is made up of different assets, such as HTML, JavaScript, CSS, and images. Each of these generates requests to render what you see on your website. Typically the more requests you have, the slower your website will load. That is not always the case, but it is true most of the time. Below we are going to break up each Pingdom section and explain in more detail what the information means as it pertains to the overall performance of your website and how to do a waterfall analysis.
Pingdom Summary
When you run your WordPress website through Pingdom it generates a performance grade, a total load time, the total page size, and the number of requests you have on your website. In our example, we are using our case study domain perfmatters.io, which is hosted on Kinsta. As you can see we ran our first test and we scored a 100/100 on Pingdom and the total load time is under 900 ms. According to Pingdom our website loads faster than 92% of tested sites and it also lets us know the total size of our combined assets and the number of requests.
Pingdom speed test before DNS
We then ran an additional test and now our total load time is 491 ms! What is that all about? You might notice this as well if you are running your website through the Pingdom speed test tool multiple times. One of the reasons this happens is because of caching, both DNS caching and server caching. Find out why further below in our waterfall analysis.
Pingdom speed test after DNS
Want to get a better Pingdom score on your WordPress website? Depending on your site and configuration it might not always be possible to score a perfect 100/100, but simply spending some time on improving your score is a good place to start. And sometimes user experience might trump some of the web performance tricks you read around the web. You can’t forget the user experience! But rest assured, we will be sharing with you some tips and tricks further below on how we got the above site to where it is, so keep reading!
Pingdom Performance Insights
The performance insights section of the Pingdom speed test tool is also very helpful. These are all based on the Google PageSpeed Insight rules. Generally, if you improve these on your site, you should see a decrease in your overall load times.
Pingdom performance insights
Leverage Browser Caching
A very common one people struggle with is the leverage browser caching warning. This is generated due to not having the correct HTTP cache headers on your web server. See our in-depth post on how to fix the leverage browser caching warning.
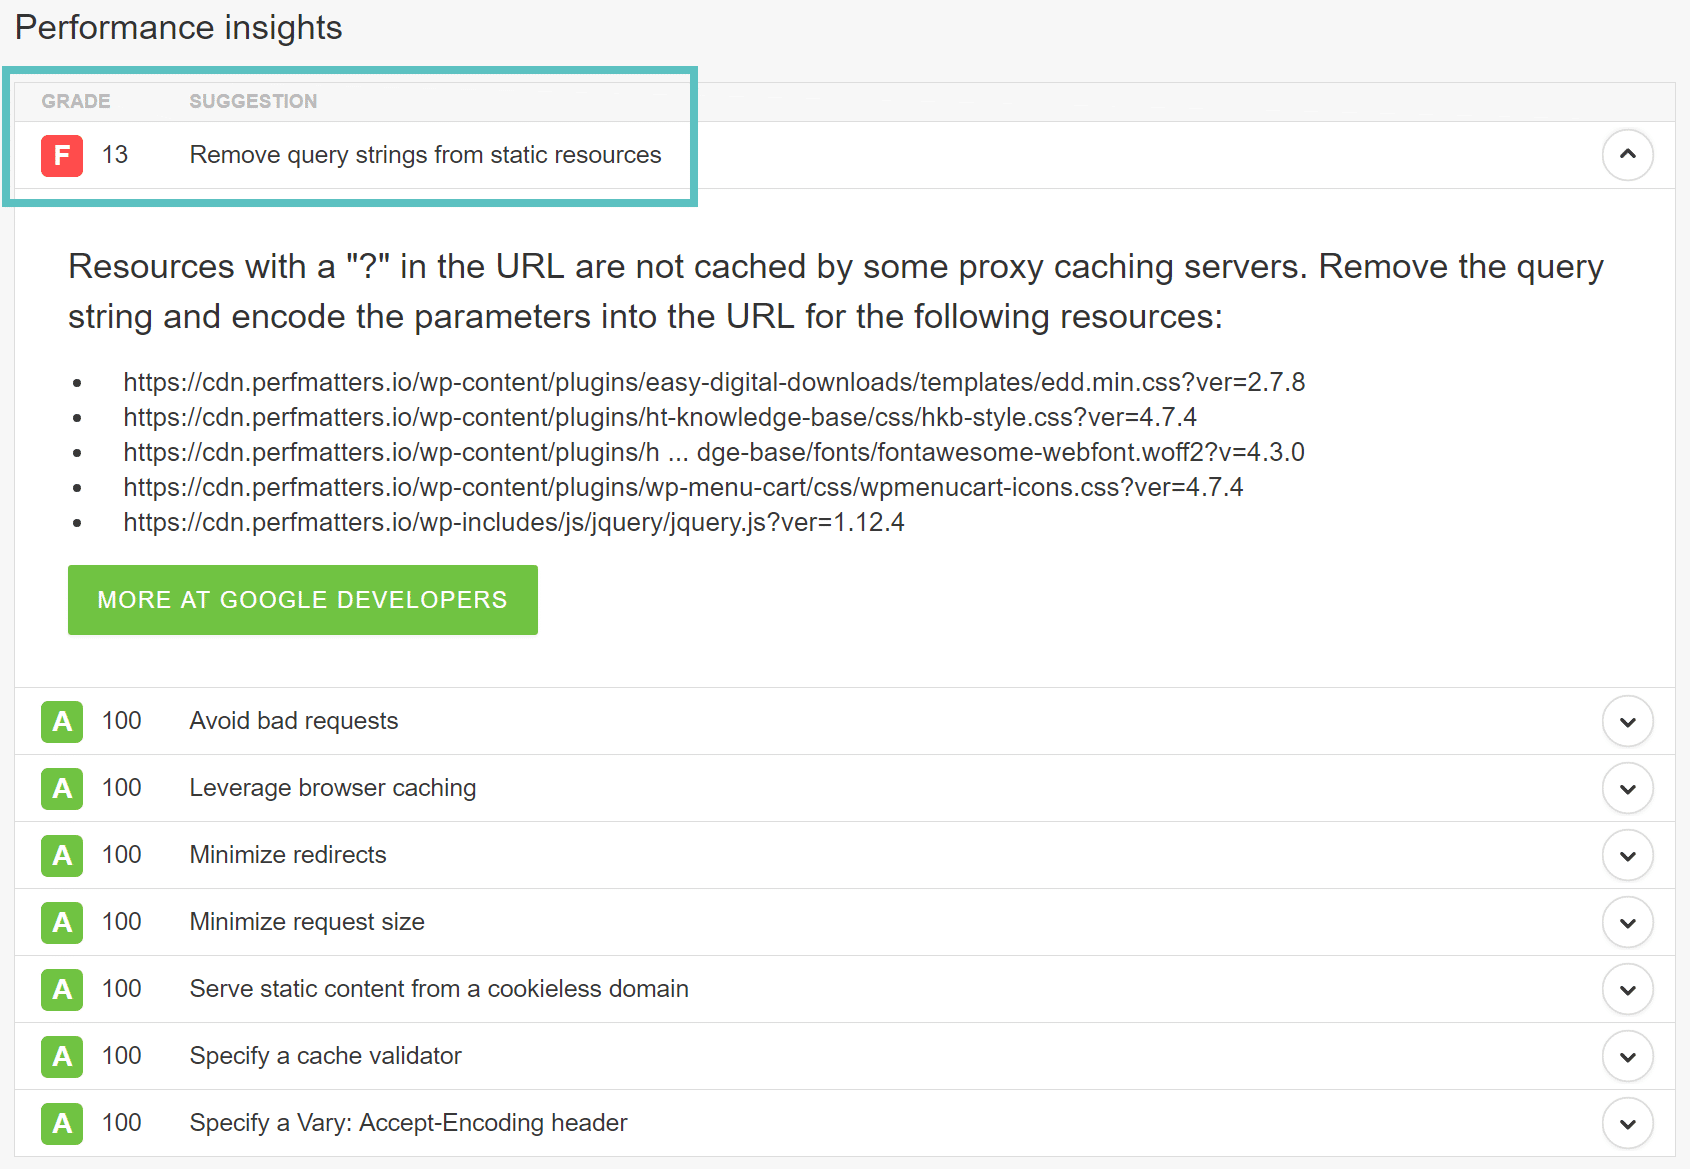
Remove Query Strings
Another common issue is dealing with query strings. Your CSS and JavaScript files usually have the file version on the end of their URLs, such as https://domain.com/file.min.css?ver=4.5.3. Some servers and proxy servers are unable to cache query strings. So by removing them, you can sometimes improve your caching. There are free plugins like Query Strings Remover which can do this for you automatically in WordPress. It is also important to note that if you are using a CDN, like KeyCDN, they actually can cache query strings which in turn means you don’t need to worry about this. See our in-depth tutorial on how to remove query strings from static resources.
Remove query strings from static resources warning
Serve static content from a cookieless domain
We have an in-depth post on how to deal with the serve static content from a cookieless domain warning. A lot of times you can ignore this warning as new protocols such as HTTP/2 now make this less important. The cost of a new connection is usually costlier than streaming everything over the same connection. However, two ways to solve this is to use a CDN provider that strips out the cookies or create a separate domain and or subdomain.
Serve static content from a cookieless domain warning
Parallelize Downloads Across Hostnames
This warning results because of a limitation of HTTP/1.1 and web browsers being limited to the number of concurrent connections they can make to a host; which is typically 6 connections. This warning is typically seen on websites with a large number of requests. In the past, the only way to get around this limitation is to implement what they call domain sharding. However, if you are using a web host or CDN provider that supports HTTP/2, you can safely ignore this now as multiple resources can now be loaded in parallel over a single connection. But you can also check out our tutorial on how to fix the parallelize downloads across hostnames warning by implementing domain sharding.
Parallelize downloads across hostnames warning
Specify a Vary: Accept-Encoding header
We have an in-depth post on how to fix the Specify a Vary: Accept-Encoding header warning. This is an HTTP header and should be included on every origin server response, as it tells the browser whether or not the client can handle compressed versions of the content.
Specify a vary: accept-encoding header warning
Specify a cache validator
This warning refers to missing HTTP caching headers which should be included on every origin server response, as they both validate and set the length of the cache. If the headers aren’t found, it will generate a new request for the resource every time, which increases the load on your server. These headers include last-modified, ETag, Cache-Control, and Expires. Read our in-depth post on how to fix the specify a cache validator warning.
Specify a cache validator warning
Pingdom Response Codes
The next section in Pingdom speed test tool is the response codes. Response codes, also referred to as HTTP status codes are like a short note from the web server that gets tacked onto the top of a web page. It’s a message from the web server letting you know how things went when the request to view the page was received. Some common ones are:
- 200: “Everything is OK.” This is the code that is delivered when a web page or resource acts exactly the way it’s expected to.
Example of Pingdom 200 response code
- 301: “The requested resource has been moved permanently.” This code is delivered when a web page or resource has been permanently replaced with a different resource. It is used for permanent URL redirection.
- 404: “The requested resource was not found.” The most common error message of them all. This code means that the requested resource does not exist and that the server does not know if it ever existed.
Example of Pingdom 404 response code
You can read more about all the different response codes in our in-depth post on HTTP status codes.
Content size and requests by content type
The next sections are the content size by content type and the requests by content type. Each of these is useful to quickly see what is taking up the most resources on your web page. According to HTTP Archive, images generally make up for 64% of an average web page’s total size. We also see this to usually be the case as well. However, as you can see below on this site, it is not always the case. In case you were wondering what the “Other” content type is below, that is being generated by our Google web font and Font Awesome fonts. Web fonts are lumped into the other category.
Pingdom content type
For optimizing your images, we highly recommend reading our in-depth post on how to optimize images for web. There are many great tools and plugins out there to further compress your images and ensure they aren’t the bulk of your website’s page load. And in our case above, the perfmatters.io site is taking advantage of using large font awesome icons in place of images. This can be one great strategy that makes a huge difference. And of course, we have some additional tips in our page speed guide on how to further decrease your content size.
Content size and requests by domain
The content size and requests by domain section is a good way to quickly see which external services and scripts on your website. In our example, you can see that we have all of our assets loading from our CDN. Then there is the initial HTML DOC load for the website from the web server, and an external call to the Google Analytics domain. Depending upon your site you might have a lot more external services, such as Facebook, Twitter, Hotjar, SumoMe, AdRoll, New Relic, CrazyEgg, etc.
Generally the fewer external requests you can make the better, because each external services introduces its own latency, TLS handshake delays, DNS lookups, etc. Make sure to read our in-depth post on how to identify and analyze external services on your WordPress site. Generally, it is best to reduce the number of requests as much as possible and host the assets in one place, such as moving them to your web server or CDN. One example would be font awesome. Instead of linking to the external script for font awesome, download it, and serve it up directly.
Pingdom requests by domain
Pingdom Waterfall Chart
And last but not least, we have the Pingdom speed test tool requests section which generates a waterfall chart of all the individual requests on your web page (as shown below). You can then analyze each request to see what is causing delays and performance issues on your site. This is what we mean when we say we are doing a waterfall analysis. Below is a more in-depth summary and or definition of what each status color means.
Pingdom waterfall analysis
DNS (Pink)
So what is DNS? Well, think of it like a phone book. There are servers called Domain Name Servers which hold the information about your website and which IP it should be routed to. When you first run your website through Pingdom, it performs a fresh lookup, and it has to query the DNS records to get the IP information. This results in some additional lookup time.
DSN delays in Pingdom
When you run your website through Pingdom more than once, it caches the DNS because it already knows the IP information and doesn’t have to perform the lookup again. This is one reason why your website appears faster after running it through Pingdom multiple times. As you can see in the screen below, on the 2nd test we ran, the DNS lookup time on the initial DOC load is 0 ms. This is one area a lot of people misinterpret! Also, you can further optimize it by using a premium DNS service, plus it comes with a lot of extra benefits.
Cached DNS in Pingdom
There are also other reasons why your website might appear faster after multiple tests. One of those is if you are using a Content Delivery Network (CDN). For those of you not familiar with a CDN, it is a network of global servers which cache your content (JS, CSS, Images, etc.) in locations closer to the visitor. When you first run your website through Pingdom, it might have to grab the assets from the CDN fresh. A CDN cache works much like DNS, once it is cached, it is then much faster on consecutive loads.
Another tip on speeding up DNS is to use DNS prefetching. This allows the browser to perform DNS lookups on a page in the background. You can do so by adding some lines of code to the header of your WordPress site. See some examples below.
<!-- Prefetch DNS for external assets --> <link rel="dns-prefetch" href="//fonts.googleapis.com"> <link rel="dns-prefetch" href="//www.google-analytics.com"> <link rel="dns-prefetch" href="//cdn.domain.com">
Or if you are running WordPress version 4.6 or newer, you might want to use resource hints. Developers can use the wp_resource_hints filter to add custom domains and URLs for dns-prefetch, preconnect, prefetch or prerender.
SSL (Purple)
The purple status color stands for the time that your browser takes to do an SSL/TLS handshake. Whenever you run a website over HTTPS it means there is an SSL certificate involved and extra time involved due to the encryption process (SSL/TLS handshake). On our example domain, we have a certificate on both our web server at Kinsta and our CDN, KeyCDN. So there is an SSL negotiation time on both the initial HTML doc load from the web server and our assets.
SSL load time in Pingdom
While there is slight overhead to running HTTPS, it very negligible now thanks to HTTP/2, which is a new protocol helping speed up the web! Due to browser support HTTPS is required to utilize HTTP/2. Check out our ultimate guide to HTTP/2. It is also important to note that not all providers yet support HTTP/2. This includes both from the web hosting side and the CDN side. So when you are shopping around for hosting and CDNs, make sure both support it! Kinsta is proud to support HTTP/2 for all of its WordPress clients.
Another thing to be aware of is that the Pingdom tool itself does not actually support HTTP/2 because it is currently using Chrome 39 to run its tests. Chrome didn’t support HTTP/2 until version 49. So keep in mind that your performance might even be better because Pingdom is not showing you the full HTTP/2 advantages. Although it will once they upgrade their test machines.
Connect (Teal)
The connect time in Pingdom is referring to the TCP connection, or the total time required to create a TCP connection. You don’t really need to understand how this works, but this is simply a communication method between the host/client and the server that has to take place.
Pingdom connect time
Wait (Yellow)
The wait time in Pingdom is actually referring to the time to first byte, also known as the TTFB in some tools. TTFB is a measurement used as an indication of the responsiveness of a web server or other network resource. Generally, anything under 100 ms is acceptable and good TTFB. If you are approaching the 300-400 ms range you might have something misconfigured on your server or it might be time to upgrade to a better web stack.
Wait time – TTFB
The easiest way to decrease your TTFB? If you have a website that is serving visitors in different parts of the country, or around the globe, the easiest way to drastically decrease your TTFB is to use a CDN. We ran a little test to show the difference.
TTFB Without CDN
We first ran a test with our CDN disabled and as you can see our total load time was 1.45 s and our average TTFB on an asset was around 136 ms.
TTFB before CDN
TTFB With CDN
We then enabled our CDN and ran the test again. As you can see our total load times dropped down to 788 ms and our average TTFB is now 37 ms! What a difference a CDN can make. Another important thing to note is that we chose the Stockholm location to perform this test. Why? Because we wanted to show you the real improvement that can be had. Our WordPress site in this example is hosted by Kinsta on the Google Cloud and located in a central location in the USA. By performing the test against Stockholm we are able to show how the CDN caching increases the speed and reduces the TTFB.
Tired of hassling with slow WordPress hosting and 500 errors?
Let Kinsta show you high-performance hosting, the right way. Combine our Google Cloud powered infrastructure, HTTP/2 CDN, and PHP 7, to see the lightning-fast load times you’ve been dreaming about!
TTFB after CDN
And of course, having a good WordPress host with a carefully thought out architecture is also crucial to lowering your TTFB.
Send (Orange) and Receive (Green)
The send and receive status’s in Pingdom don’t really need much of an explanation. The send time is simply the time it takes for the web browser to send data to the server. And the receive time is the time it takes for the web browser to receive data from the server. Both of these will usually be very low or non-existent in your tests.
HTTP Response Headers
You can also click on an individual request while doing your waterfall analysis and see the HTTP response headers. This provides valuable information. In the screen below we can instantly see things such as gzip is enabled on the web server, it is running over HHVM, it is being served from cache (HIT, would show MISS otherwise), the cache-control headers, expires headers, the browser user-agent and more.
HTTP response headers
Case Study Domain Configuration
If you got this far down in our waterfall analysis post then you are in for a treat. It is always annoying to see people share tips and case studies but then not share how they got there. So below is our exact configuration for the case study domain used above! Feel free to replicate it.
Architecture
- The case study domain (perfmatters.io) is hosted with Kinsta on the Google Cloud Platform in the USA (Central location). Kinsta uses HTTP/2, Nginx, MariaDB, which all contribute to the fast load times.
- The site is using HHVM. HHVM and PHP 7 are both known for their awesome performance. Kinsta allows you to switch between the two with press of a button.
- The site is not using any caching plugin. Kinsta caches everything at the server level which greatly simplifies things!
WordPress Plugins
And here is a list of the plugins being used on the WordPress site. As you can see many of the plugins are actually free.
Note: For some of the smaller plugins like Disable Embeds, Disable Emojis, etc. You could always inline the minified embed JS instead of installing the plugin. But either way, these plugins are very small and lightweight.
Recommended Tutorials for Further Reading:
Summary
As you can see, knowing how the Pingdom speed test tool works a little better and what all the charts mean can help you make a more data-driven decision when it comes to performance. A waterfall analysis as we call it is crucial to know how your individual assets load. Got any other great Pingdom tips?
If you would like to see more in-depth articles like the one above, please let us know below in the comments!