
Are you making the most out of the data you can get about your website from Google Analytics (GA)?
The free tool gives you valuable insights into metrics like conversion rates, traffic sources, engagement, audience demographics, and more.
Let’s learn what GA is and how to use it to improve your website’s metrics.
What Is Google Analytics?
Google Analytics is a free tool to track user behavior on your website. With a range of metrics to explore, you can start to get a picture of how people use your website and how you can make changes to increase sales.
On a basic level, you can track how many visitors you have, how they found you, the number of views a page receives, and more.
In many ways, Google Analytics is the portal giving you insider, back end, and real-time access to what your users want.
Why Should You Use Google Analytics?
Google Analytics is the most powerful tool to track website metrics, and it comes from the king of search engines. On top of that, it’s free.
Although it takes some work to get set up, there are plenty of online tutorials and resources to walk you through the process. Once you get Google Analytics connected to your site, you can head to the Google Analytics dashboard and start checking things out. It can’t go back in time, though, so you will have to wait for data to gather.
Google Analytics can free you from relying on gut checks and intuition and instead tell you what pages and which content hit the mark or fall short. In this way, you can make informed choices.
The Basic Google Analytics Interface
Once you set up your Google Analytics account, you can connect different URLs and choose which one to explore from the drop-down.
The first thing Analytics shows is basic traffic data, including dates. You can alter the dates based on your needs.
On the left side of the screen, Google Analytics provides a list of report options. This is where you can start to get into the details.

On the far right, there’s a blue box with real-time metrics showing how many people are on the site, how many pages are viewed per minute, and the most popular pages to view. You can then click on the blue box to learn more about the data.
If you’re looking for something specific, just type it into the handy search bar.

As you scroll down, you can check out different analytics, including where your users come from and what devices they use.
Common Metrics Tracked With Google Analytics
There are many metrics you can track using Google Analytics.
No matter which type you focus on, you need to choose a time frame for your data. This way, you can check a specific timespan against prior spans to see what’s changing and if what you’re doing is working.
As you analyze the data, try to remember what your marketing goals are. Otherwise, you may get overwhelmed by the whirlwind of numbers.
Let’s look at some of the most popular metrics just to get you started.
Tracking Visitors With Google Analytics
Tracking visitors shows who’s visiting, how many visitors you have, and what they’re doing on your website. This includes factors like bounce rates and session durations.
These metrics are anonymous and vague. You can’t gather personal details for specific visitors to your website.
To dig deeper, you can go to the “Audience” section of Google Analytics.
Tracking Traffic Sources With Google Analytics
Another powerful metric Google Analytics can provide is traffic sources. It answers the question, “how are people finding my website?” You can find this information under the “Acquisition” tab.
For instance, you can find out how much traffic comes from social media, Google Ads, and the Google Search Console. Knowing where your visitors are coming from and what they do once they get to your site can help you know where to focus your marketing efforts.
Tracking Content With Google Analytics
Google Analytics can help you understand how well different pieces of content perform by tracking user behavior. For example, are they visiting certain pages more often than others? Is on-page time higher on some types of content? This can help you determine what works and what doesn’t, which you can use to inform future content creation and marketing choices.
You can find this information under the “Behavior” section.
Tracking Conversions With Google Analytics
Let’s get down to brass tacks here. Are people buying (or doing whatever else you want them to do) once they land on your website? That’s what conversion metrics on Google Analytics can tell you.
These metrics are not automatically generated like the previous ones. Instead, conversion analytics requires you to set goals, typically using the pages visitors are directed to once they convert. Telling Google Analytics to follow users to these final pages can provide more specific information about how people are getting there, how many are converting, and more.
Track Mobile Performance
As mobile use becomes the norm, you may want to see how well your website performs on mobile devices.
These metrics can be found in the “Audience” section under “Mobile.” Here, you can see website metrics broken down by device categories. For example, if you find certain device users are spending less time or money on the site, look into how your site looks and behaves on that type of device.
Creating Custom Reports
As you get a handle on following your website’s metrics, you may find you need custom Google Analytics reports. Custom reports can help you check specific metrics more efficiently, using apples-to-apples comparisons between periods, campaigns, and more.
These custom reports may help when presenting information to your department, organization, leadership, or investors thanks to the hard numbers you can compare and the visual reports you can run. Of course, not everyone may fully understand what you do, but many are likely to understand the basics of what these numbers and graphs mean.
Other Common Google Analytics Functionality and Uses
Google Analytics is constantly rolling out new features that may help you meet your marketing goals. Let’s dive into a few.
Learn What People Are Searching for on Your Site
If you have a lot of content on your website, you may have a search function available to users. Knowing what people type into that search function can help you understand why visitors are on your site, allowing you to plan for and create more relevant content.
Under the “Behavior” area, click “Site Search” to view this information.
Identify Your Worst Performing Pages
Is there content on your website that’s just not performing? Then, you may benefit from optimizing those pages for SEO, deleting useless content, or creating entirely new work.
To learn which pages are not performing, go to “Behavior,” then “Site Content.” From there, click on the arrow to reorder the pages by popularity. This shows which pages get the fewest views. Do with that information what you will—though perhaps consider finding a cause before throwing the page into the abyss.
Find Where People Abandon Their Shopping Carts
People abandoning shopping carts while shopping is a typical e-commerce problem. If you can find where visitors are dropping off your website, you can make improvements to help convert them.
First, set up your goals using a sales funnel. Include each step of your check-out process, including cart, check-out, shipping, and confirmation, in the pages you plan to monitor. Then, click to “visualize your funnels” to see how people behave as they move through the funnel.
You may see a pattern regarding when people abandon carts begin to emerge and make updates accordingly.
See Your Most Important Analytics First
As we talked about above, Google Analytics places many of the most common analytics on the dashboard. However, you can set up a custom dashboard to see exactly what you need. Under the “Customization” tab, find the link for “Dashboards.” You can use a dashboard template or create your own.
How to Create Custom Reports in Google Analytics
Google Analytics makes it easy to create custom reports for your own use or presentations.
- First click on “Customization,” then click on “Custom Reports
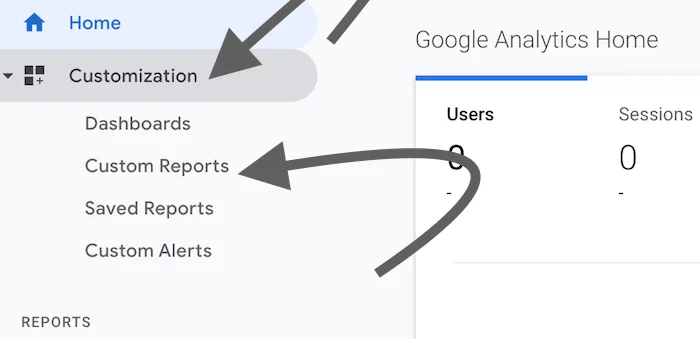
- Click on “+ New Custom Report” to get started
You can name your custom report, as well as each tab you want to create if you want different variables in the same report.
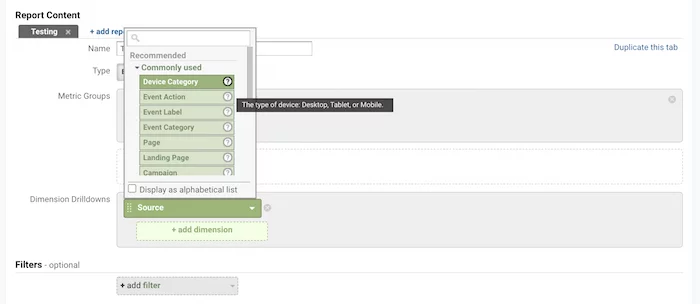
- Choose what you want to create the custom report to report on, including overarching metrics you can choose from a dropdown, more specific dimensions, and filters to fine-tune your data thoroughly.
If you scroll over the question mark in the dropdown, you can learn more about each choice.
- Click on whether you want to see all views or limit them.
Start with all, if you’re not sure. Now click “Save.” You’ll be taken to a page with the data automatically. From here, you can save, export, share, or edit the report.
If you save it, you can find this report under “Saved Reports.”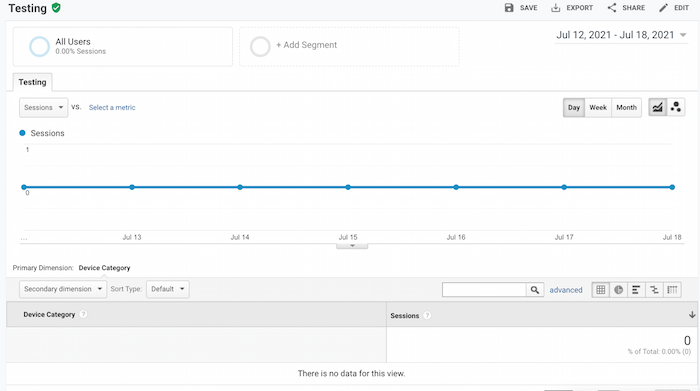
To rerun this custom report, go to “Custom Reports.”
Google Analytics Basics FAQs [wp editor: add schema]
What are some basic things you can do with Google Analytics?
Google Analytics can give you information about who visits your website, how many views your website receives, which content is the most popular, and more.
What is the best way to learn Google Analytics?
You can learn more about the basics of Google Analytics from Google themselves.
What is a Google Analytics tracking code?
Google Analytics uses a tracking ID, which you place in the code of your website or a plugin to allow Google to receive information about your website.
How much does it cost to use Google Analytics?
Most of the benefits of Google Analytics are free, though you can choose to purchase upgrades.
What is the benefit of using Google Analytics?
Google Analytics provides in-depth information on how well your website is performing.
{ “@context”: “https://schema.org”, “@type”: “FAQPage”, “mainEntity”: [ { “@type”: “Question”, “name”: “What are some basic things you can do with Google Analytics? “, “acceptedAnswer”: { “@type”: “Answer”, “text”: “Google Analytics can give you information about who visits your website, how many views your website receives, which content is the most popular, and more.” } } , { “@type”: “Question”, “name”: “What is the best way to learn Google Analytics?”, “acceptedAnswer”: { “@type”: “Answer”, “text”: “You can learn more about the basics of Google Analytics from Google themselves.” } } , { “@type”: “Question”, “name”: “What is a Google Analytics tracking code?”, “acceptedAnswer”: { “@type”: “Answer”, “text”: “Google Analytics uses a tracking ID, which you place in the code of your website or a plugin to allow Google to receive information about your website.” } } , { “@type”: “Question”, “name”: “How much does it cost to use Google Analytics?”, “acceptedAnswer”: { “@type”: “Answer”, “text”: “Most of the benefits of Google Analytics are free, though you can choose to purchase upgrades.” } } , { “@type”: “Question”, “name”: “What is the benefit of using Google Analytics?”, “acceptedAnswer”: { “@type”: “Answer”, “text”: “Google Analytics provides in-depth information on how well your website is performing.” } } ] }
Basics of Google Analytics Conclusion
Google Analytics provides nearly endless amounts of information about your website’s data. Once you set up Google Analytics on your website, you can access metrics covering nearly every part of your customers’ journeys.
You can create custom reports to analyze how well your strategies work. This may help you make informed changes to your website, which may, in turn, draw even more people to your brand and via your analytics-driven marketing strategy.
What’s your favorite Google Analytics feature?