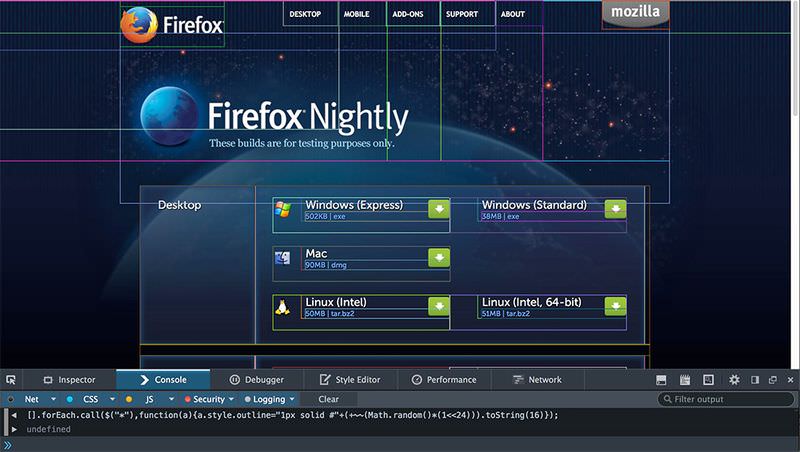
How many times have you struggled to find one specific problem messing up your CSS layout? From missing closing tags to improperly nested siblings, CSS issues are a dime a dozen. And with this CSS layout debugger, the process just got a lot easier.
This one line of code will traverse the DOM and outline each element with a different color. This way you can better visualize how your CSS is working (or not working) and quickly spot problem areas.

GitHub allows developers to save little bits of code called Gists. These are all open source and free to save for your own use. That’s why this CSS debugger is so useful. It combines the modern prowess of Chrome DevTools with the simplicity of browser bookmarklets.
To use this code, you should first copy whichever version you like the best from the Gist page. Then, you paste that code into your Terminal window and run it. You should end up with a result like this:

Now, it is possible to save this code as a bookmarklet in your browser toolbar. But if you’re a Chrome user you can save this JS code as a code snippet which is much easier to run.
This code snippet can be recalled over and over at the click of a button. You can parse every page, full of these colorful CSS outlines, for DOM elements of parents and children alike.
However, you shouldn’t feel limited only to Chrome. This snippet works for all major browsers, including Firefox, Safari, Opera, and Internet Explorer.
And for anyone curious to learn how this works, you can check out the annotated version with comments for each line of code.
This Gist is full of related user comments and updates from other developers helping to make it smaller and more efficient. But in its current state, this is one of the simplest ways to debug any DOM with a single line of code.

Read Also: How to Refactor CSS – A Guide
The post This CSS Layout Debugger Will Be Developer’s Next Best Friend appeared first on Hongkiat.
