At this point, you’ve created your knowledge base. You researched your customers’ tripping points. You wrote some awesome help articles. Now you’re done. Finished. Finito…right?
Sorry, but not quite. Hitting publish on your final help article is not the end of your journey. As we’ve touched on before, your knowledge base is the product of a constant process of creation and revision. Constant, not one time. Sorry!
And to optimize that process, you need to understand the data behind the people using your knowledge base. That’s what this post is all about: knowledge base analytics.
You’ll learn how to discover what people are searching for, where they come from, how they use your knowledge base, and which knowledge base articles make them hit the eject button and jump to your live support channels.
How To Track Knowledge Base Analytics
Before I get into how you can use analytics data to improve your knowledge base, it’s important that I lay out a few assumptions for what data you actually have.
At a minimum, I’m assuming you have Google Analytics tracking installed. For all of these insights, I’ll be referencing specific Google Analytics reports or functionality. If you don’t already have Google Analytics installed, most knowledge base solutions should make it easy to implement.
I’ll also cover a few ways in which we designed our products to help you gain easy access to important insights.
With that out of the way, let’s get into it…
Learn What Your Knowledge Base Users Are Searching For
If you’ve ever heard of a little company called Google, you should know that there’s value in figuring out what people are searching for and helping them find that information.
Collecting search analytics essentially tracks every search query users enter into your search form. Then, it goes one step further and tracks whether or not that search query returned a result. Here’s why that’s helpful:
First off, search analytics can help you find missing articles. If a high number of your customers are searching for an article that doesn’t exist, you should probably go ahead and write that article, right? I talked about this tactic as a pillar of running a knowledge base audit.
But search analytics aren’t just about missing articles. Learning about search also helps you understand which topics are popular and how your users think.
For example, if most people search for help articles using a specific set of terms, you might want to consider incorporating those terms into your actual product to improve its usability.
How to Find Search Analytics for Your Knowledge Base
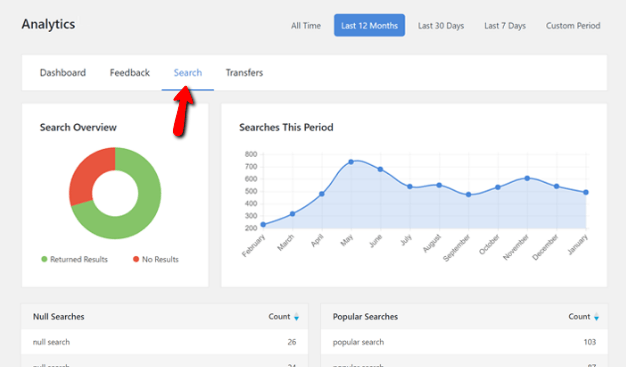
If you’re using one of our knowledge base solutions, you can head to the Search tab of your in-dashboard Analytics page:

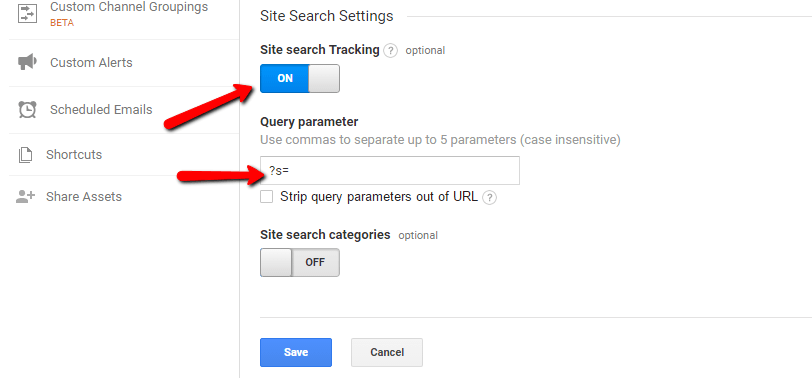
If you’re using Google Analytics, you need to first enable Site search Tracking by going to Admin ? View ? View Settings. Scroll to the bottom and turn on Site search Tracking. Make sure to add the query parameter for your knowledge base’s search function (e.g. “?s=”):

Then, you can view search terms by going to Behavior ? Site Search ? Search Terms.
Use Behavior Flow to See How People Navigate Your Knowledge Base
When you structured your knowledge base, you created it in what you thought was a logical manner. That is, you divided up the categories and organized the articles based on how you thought your customers would want to move through your knowledge base.
Behavior Flow helps you figure out if your assumptions were right or wrong. See, there’s this thing called the Curse of Knowledge. Basically, you know far more about your product than your visitors. I mean, of course that’s true. You built the thing!
But that means what you view as “logical” might not always match up with what your less-knowledgeable customers view as logical.
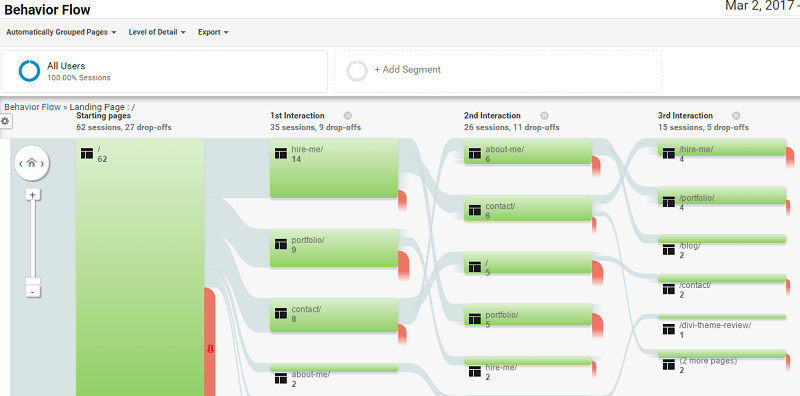
With Google Analytics’ Behavior Flow report, you can view a diagram of how people actually “flow” through your knowledge base. For example, here’s the Behavior Flow for my personal website:

You can see that most people click to my Hire Me page first, despite the fact that my main CTA is to View My Portfolio. Hmmm, it appears my expectations did not match up with reality! I should probably fix that.
And when you view the Behavior Flow for your knowledge base, you’ll be able to find similar inconsistencies between what you thought would happen and what actually happens.
Then, you can restructure your categories and article ordering/interlinking to better match how people use your knowledge base in real life.
To view the Behavior Flow report, go to Behavior ? Behavior Flow in Google Analytics.
Figure Out Who’s Using Your Knowledge Base
If there’s one data point you need to know about your knowledge base, it’s this one:
Are most of your knowledge base readers paying customers or prospective customers browsing around?
You might think that only existing customers use your knowledge base, but I promise you that’s not the case. Especially if you’re properly optimizing your knowledge base for SEO.
The Google Analytics New vs Returning report will quickly tell you whether users are new to your site or have visited before:

While not 100% accurate in all situations, you can safely assume that:
- Most New Visitors are not your customers (yet!)
- Most Returning Visitors are your customers
If most of your visitors are existing customers, you can tailor your content towards topics only users need to learn about.
But if you have a high percentage of new visitors, you may want to include some articles covering relevant pre-sales topics.
To view the New vs Returning report, go to Audience ? Behavior ? New vs Returning in Google Analytics.
Learn Which Articles Push Readers Towards Live Support
You invested time and effort into creating a knowledge base so that you could take pressure off of your live support channels, right? So if certain articles aren’t accomplishing that goal, you need to be able to single out those articles for changes.
For example, if you find that your article on “Creating a new widget factory” leads to 50% more live support requests than other help articles, you should try to restructure the article to reduce the number of live support requests it generates. Makes sense, right?
But how can you find that data? Two ways:
First, if you’re using one of our knowledge base products, we actually do the work for you. We provide the option to enter something called a Transfer URL. This is basically the URL for your live support channels. Then, we log which articles generate clicks to your Transfer URL.
When you go to the Transfers tab of your Analytics dashboard, you can quickly view:
- Individual articles which generate the most live support requests
- Article categories which generate the most live support requests
- Your overall transfer percentage (a good benchmark to find articles which are outliers).

If you’re using a different knowledge base solution, you can still collect this data…but you’ll need to do a little work.
Using Google Analytics, you need to create what’s called an Event for when a user clicks to your live support channels. You can view Google’s Event explanation here.
There are two essential things to track:
- The outbound click (that is, clicking to your live support channels).
- The page the user clicked from (that is, which article caused a live support request).
If you’re not code-savvy, you might need to ask your developer for help setting up the proper event tracking.
Once it’s set up, you can view the Events report by going to Behavior ? Events in Google Analytics.
Wrapping Things Up
Want the best tip to make your knowledge base analytics life easier?
Create a Google Analytics dashboard that includes all of these reports. That way, you can click once and view all of the relevant analytics for your knowledge base.
This was the impetus behind the Analytics tab in our knowledge base themes and plugins – one spot where you can view all of the relevant analytics for your knowledge base.
You don’t need to check in every day, but poking your head in every week or two will go a long way towards keeping your knowledge base healthy.
The post How Analytics Can Make Your Knowledge Base More Efficient appeared first on HeroThemes.