An ideal website should have a range of 26-40% of bounce rate. Recent studies state that if a website takes more than 5 seconds to load, then the bounce rate of the website rises to 70%. A slow website influences the SEO of your website both on desktop and mobile. Several factors can slow down your website speed. The contents of your website, such as videos, images, posts, and more, can be a factor that affects the speed of the website.
A webpage loading time is a time a website takes to load a webpage from the servers and display it on the browser. The website speed has a significant impact on user experience, as the average users expect your website to load in under 2 seconds. If the website is slow, then it can lead to a bad user experience. To know the factors that can affect the slowness of your website, follow the link: https://www.interserver.net/tips/kb/website-loading-slow/.
In this tutorial, we learn about the tools that help us to analyze the performance of your WordPress website.
Tools to Test the WordPress Website’s Performance
Many tools are nowadays available in the market to test a WordPress website’s performance, and some of the best tools to test the WordPress Website’s performance are:
1) Google PageSpeed Insights
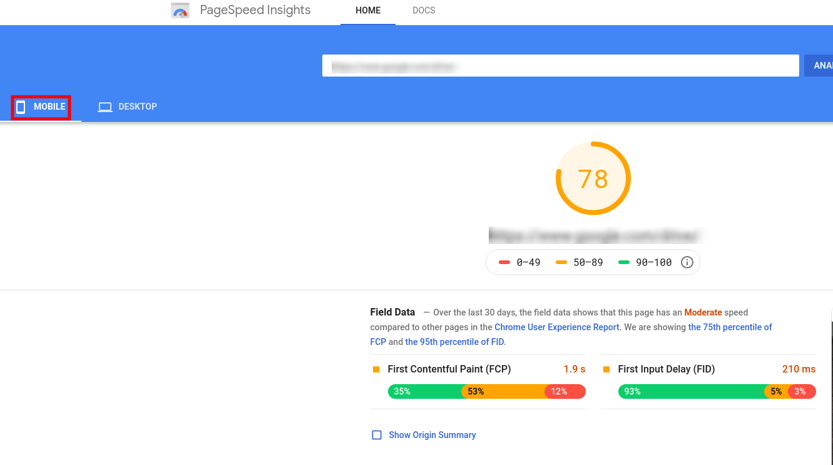
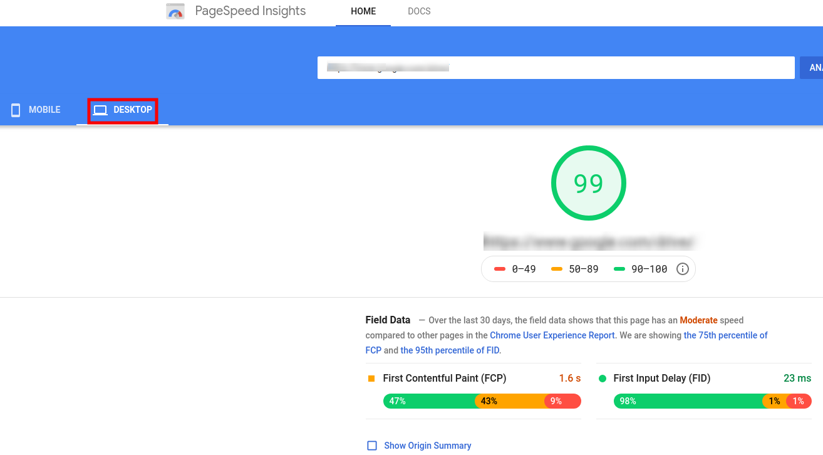
One of the best online tools that help to analyze the performance of a website is Google PageSpeed Insights. This tool also provides some suggestions to optimize the website pages and to speed up the website. This tool helps you to analyze the website performance from any browser. The free Google PageSpeed Insights tool helps to score the speed and performance of a website’s desktop and mobile versions. The website’s performance is graded on a scale of 1 to 100 and divides it into different categories as low, medium, and high based on its priorities. It is always important to check the performance of the mobile version since the mobile traffic is increasing these days.


The two screenshots mentioned above are the performance analysis of both the mobile and desktop version of a website. The First Contentful Paint (FCP) mentioned in both the screenshot with a tri-color bar is the time taken by a website to display or paint the content on the screen. In the above scenario, the desktop version of the website loads 47% of the website content in less than 1 seconds, and the mobile version of the website loads 35% of the website content in less than 1 seconds.
The second tri-color is the First Input Delay (FID), and that is the time taken by the website to respond to the first interaction. In the above desktop version of the site, around 93% of the initial interaction responded to is in less than 100ms.
This site also displays different suggestions to improve website speed and performance. The Google PageSpeed Insights report also displays some of the other parameters affecting the performance, but these parameters won’t directly affect the performance score of the website.
2) GTmetrix
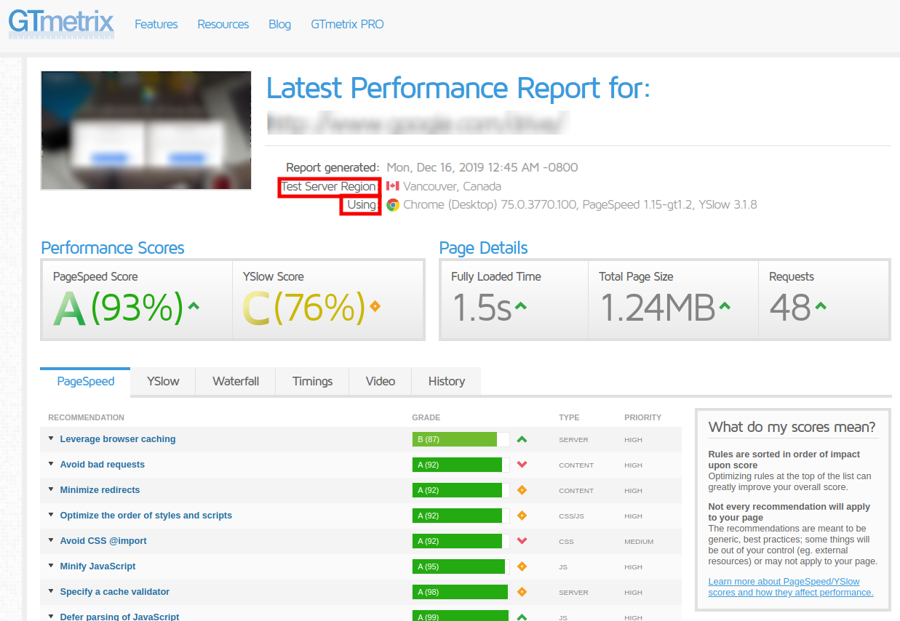
GTmetrix is one of the free and most popular tools used to analyze website speed and performance. This tool displays a detailed performance report, which has made them famous in the WordPress community. The free signing up to GTmetrix can unlock several customization options of the tool. This tool provides diversity in analyzing the content and its rule by generating two different score scales. The PageSpeed and YSlow categories display the score based on the generated rules and not based on the website contents.
Seven test locations are available in the GTmetrix tool, and you can choose any one of the lists and then also set the test browser to either Chrome or Firefox. Also, select the type of internet connection before analyzing the website speed and performance.

The two sections of the GTmetrix scorecard are the top tabs and the bottom list. The top tab displays the overall PageSpeed and YSlow score. The YSlow score mainly deals with the front-end structure of the website, the number of requests, load time, and total page size. And the bottom list displays the performance insights in detail. The bottom list further splits into different tabs, such as PageSpeed, YSlow, Waterfall, Timings, History, and Video. Each of these tabs displays different performance insights in detail. For example, the Waterfall tab graphically displays the time taken to load each element, and the History tab graphically displays the previous results of your website.
The GTmetrix also provides an automatic feature to test the loading time of your website at regular intervals.
3) Pingdom Tools
The Pingdom is a website monitoring tool that helps to analyze the website speed. The Pingdom tools have seven test servers on different locations, and you can select the server near to your location before running the test. A severe drawback of the Pingdom Tools free version is that there is no option to select the connection speed or browser.
The Pingdom tool analyzes and scores the performance of your website in a range of 1 to 100. This tool also displays the load time, the number of requests, and page size along with the performance grade. This tool has a unique feature as it displays the percentile of your website’s performance in comparison with all the websites tested with this tool or platform.


Final Word
The Google PageSpeed Insights, GTmetrix, and Pingdom are the most common tools that help to analyze the website’s performance. Some of the other tools that help you to analyze the WordPress Website’s performance are:
- Sucuri Load Time Tester
- Yellow Lab Tools
- YSlow
- WebPageTest.org
- Site 24×7 and more
Please comment below for any questions or queries. If you are an InterServer customer, please reach out to our support team for further help.
The post Best Tools to Test WordPress Website’s Performance appeared first on Interserver Tips.