As a critical source of trending internet conversations, Twitter can be a valuable marketing channel. But to use the platform to its fullest potential, you need to know the ins and outs. That means staying updated with the latest Twitter statistics to understand how people are using the platform.
So to make sure you get the freshest stats to shape your strategy in 2021, we’ve put together 13 of the most important ones for you. These will tell you if it’s time to do another Twitter audit or how to readjust your approach. Check out the most important Twitter stats you need to know this year:
1. The number of monetizable daily active users continues to increase
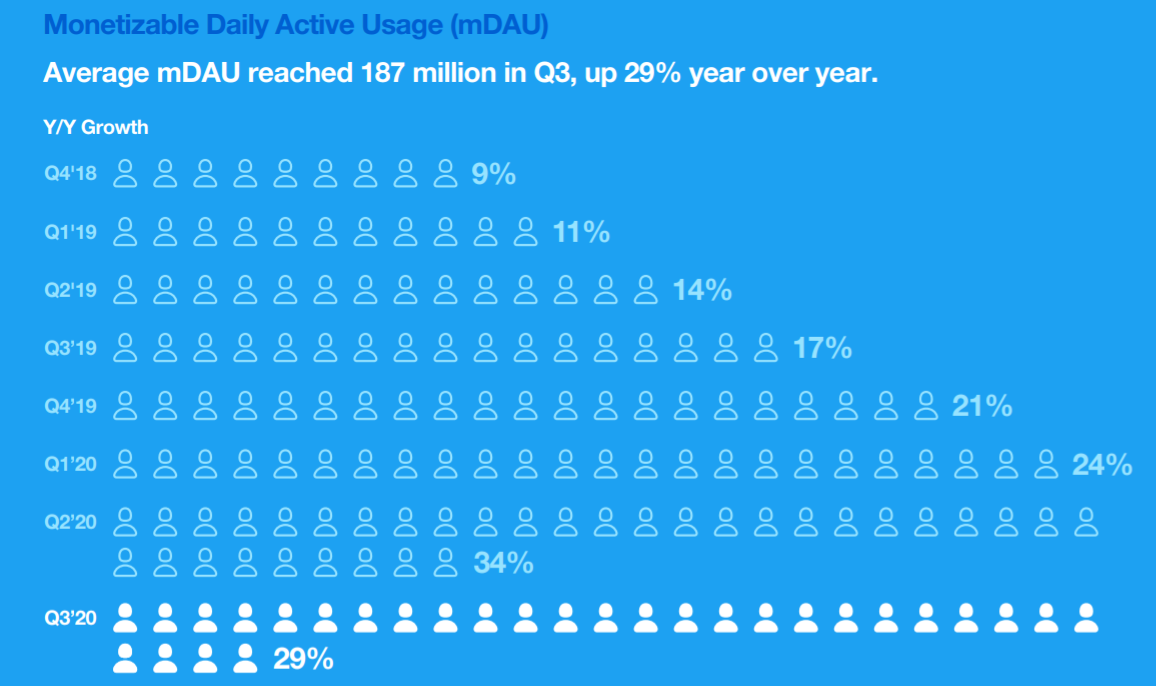
By Q3 of 2020, the average monetizable Twitter daily active users had reached 187 million, according to Twitter’s Letter to Shareholders for that quarter. This marks a 29% increase year over year.

Notice the use of the term, “monetizable,” which refers to only the accounts that can see advertisements on the platform. This means that only a portion of the Twitter user-base contributes to the platform’s ad revenue.
Meanwhile, the overall Twitter user growth continues to grow steadily. By Q1 of 2019, the number of Twitter monthly active users (MAU) had reached 330 million. But from Q2 of the same year, the company refocused its reporting to monetizable daily users instead.
According to Twitter, much-discussed current events were a factor contributing to the increase in monetizable daily active users. For instance, the increased conversation around COVID-19 on a global scale and the lead-up to U.S. elections drove interest.
2. Most Twitter users are Americans
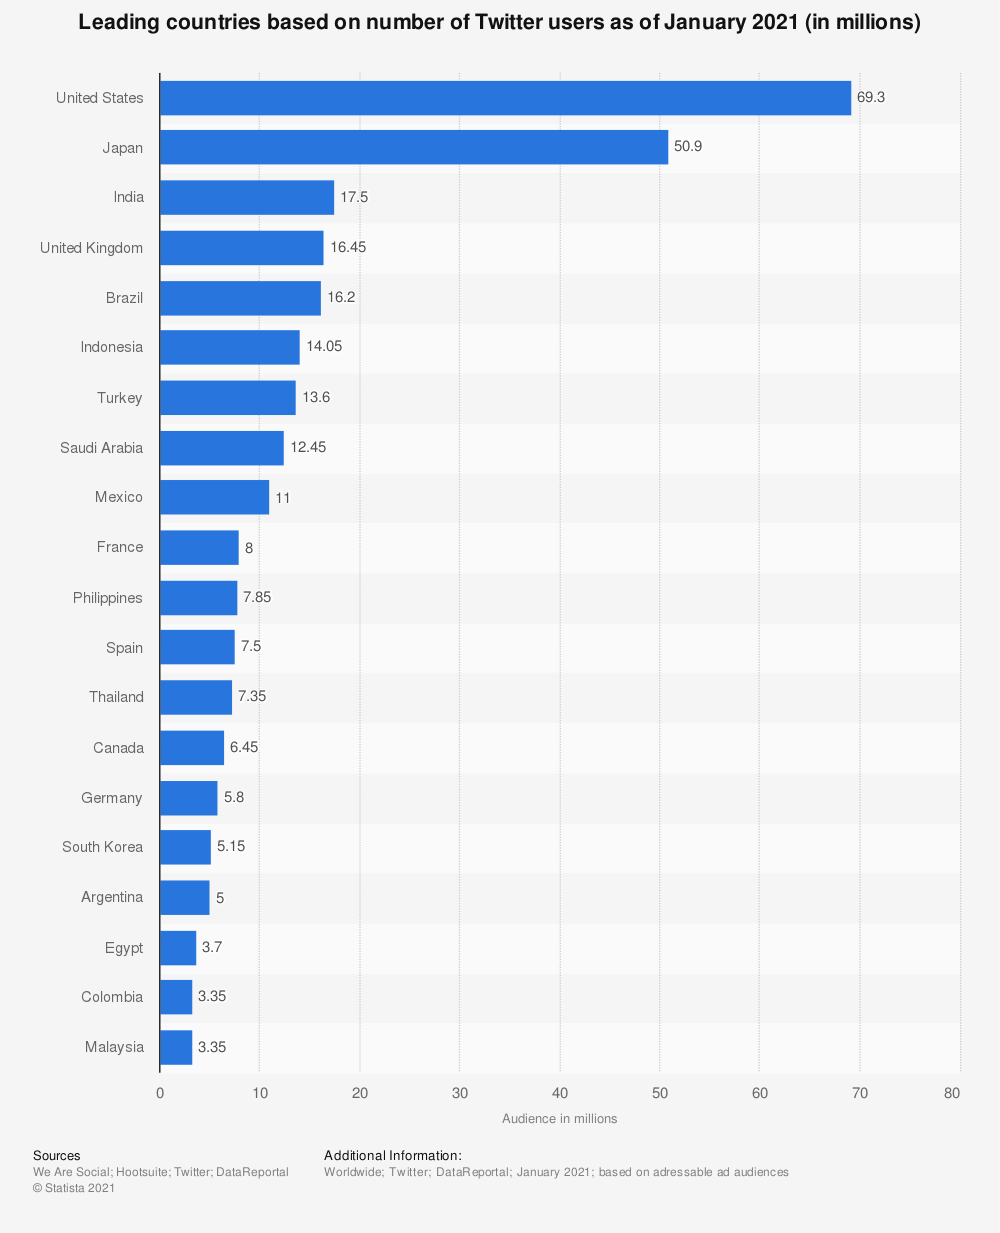
A majority of the platform’s users are Americans: approximately 68.7 million as of October 2020. Japan and India follow the US as top countries in Twitter’s international userbase.
The large American userbase makes Twitter a crucial marketing and communication channel for U.S.-based brands. It’s even an ideal platform to deliver quick and reliable customer service.

3. More than half of American Twitter users use it daily
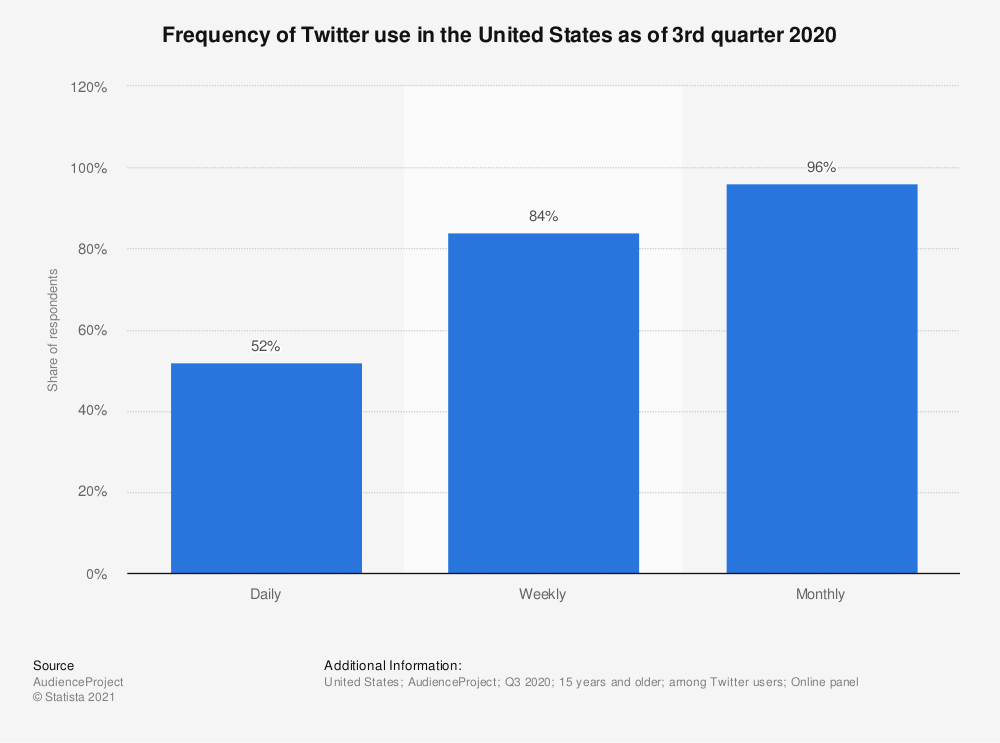
According to the latest Twitter usage statistics, 52% of Twitter users in the United States access the platform on a daily basis. Beyond this, 84% of American Twitter users access the platform weekly.
These statistics indicating high frequency of usage show the value of the platform for regularly checking in on news updates and how trending topics are evolving.
Finally, 96% use Twitter at least monthly.

4. 28.9% of Twitter users are in the 25-34 age group
As for the overall age demographics of Twitter users, millennials and Gen Z make up a majority of the user-base. Twitter usage is most common in the 25-34 age group, which makes up 28.9% of the total user count as of October 2020. People aged between 35 and 49 come in second, making up 28.2%. And 21.6% of the Twitter user-base is between the ages of 18 and 24.

While these numbers give you a high-level look at who is using the platform, the demographic groups that are interested in specific subjects or brand categories can vary significantly. Make sure to conduct a Twitter analytics to see what the demographics are for your business account. This can help you get specific details about what kind of audience you’re attracting so you can align your strategy accordingly.
5. Twitter users send out 500 million Tweets per day
With Twitter usage being so commonplace, you might be wondering how many Tweets per day the platform sees. According to Internet Live Stats, Twitter users send out approximately 500 million Tweets every day. This adds up to about 200 billion Tweets per year.
If this sounds like an overwhelming amount of content to figure out what to tweet from your own account, use tools like social listening to narrow down on the specific (and much smaller) conversations that your specific audiences are focusing on.
6. The pandemic significantly affected Twitter usage
While Tweet trends change every year, 2020 was a bit different. In the midst of a global health crisis, the platform acted as a place for people to come together to check news, updates, connect and stay entertained during quarantine. This had a significant impact on Twitter stats and conversation trends on the platform.
According to a Twitter recap, the platform saw more than 7,000 Tweets about TV and movies every minute. And the house emoji had a 40% increase in usage. On top of this, Tweets about cooking almost tripled during 2020, with several food and beverage emojis seeing a significant increase in usage worldwide.

For 2021, we can only expect to see a new round of trends as the situation and focus of conversation continue to change. So make the most of Twitter listening to find out what your target audience is talking about and where the conversation originates before you jump into the middle of a random conversation.
7. There were 2 billion Tweets about gaming
With the pandemic forcing a large portion of the population indoors, many people turned to activities like gaming to pass the time. As such a lot of the conversations happening on Twitter revolved around video games, making it an ideal platform for social media marketing for the games industry. Throughout the year, there were a total of 2 billion Tweets about gaming, amounting to a whopping 75% increase from 2019.
In fact, the number of people talking about gaming on Twitter also increased with this rise in volume. The topic saw a 49% increase in unique authors. And among video games, Animal Crossing: New Horizons was the most Tweeted about.

8. Twitter saw a 15% year-over-year increase in ad revenue
Along with the increase in average monetizable daily active users, Twitter is also seeing an increase in ad revenue. Twitter’s ad revenue increased 15% year over year to $808 million in Q3 of 2020.
According to Twitter, this increase in ad revenue was at least partly driven by previously delayed product launches and events being revisited and starting up again, frequently in a digital form.
Twitter also made several efforts to improve the advertising experience for brands. They’ve since introduced new ad formats and the beta Branded Likes, which allows advertisers to create customized “like” buttons with animated brand imagery.
Plus, they rebuilt the First View ad format, which drives an average of 30-40% impressions per advertiser. These enhanced experiences have led to advertisers spending more on the platform.
And as a result, Twitter’s total revenue also saw an uptick. During Q3 2020, the platform raked in $936 million in total revenue. This 14% increase is largely due to the global recovery of advertising revenue.

During the same quarter, advertising revenue in the United States overall saw an increase of 11% at a total of $428 million. This marks a positive change after a 25% decrease in the previous quarter, where the impact of the pandemic was strongly felt across industries.
9. Ad engagement is also on the rise
2020 saw Twitter users engaging more with ads on the platform. There was a 35% increase in total ad engagements on Twitter. This is largely due to the growth in ad impressions resulting from the increase in monetizable daily active users. The increased demand for ads also played a critical role.
According to the stats for Q4 2020, cost per engagement on Twitter decreased by 3%. These changes could make a Twitter advertising strategy a compelling option for brands not currently investing in one
10. Twitter usage is increasing for both marketers and consumers
In tune with the increase in monetizable daily active users, marketers are also expressing their intention to increase their Twitter usage. The Sprout Social Index, Edition XVI found that 53% of marketers are planning to use Twitter more in the coming year.
This makes sense since consumers are also increasing their use of the platform. The same survey found that 34% of consumers plan on using Twitter more in the coming year.

11. People are increasingly following Topics on Twitter
Twitter intends to make it easier for people to find what they’re looking for when they come to the platform. That’s why the company focused on better organizing content around Topics and Interests. In Q3 of 2020, Twitter managed to expand the number of Topics people can follow by approximately 25%, with more than 5,100 options.
It provided increased personalization for each Topic and expanded on several of them. As a result of these efforts, there was a 40% quarter-over-quarter increase in the number of accounts following Topics in Q3 2020, with 70 million accounts now following Topics.
12. People open articles 33% more often before Retweeting
Twitter also experimented with a prompt, which encouraged users to read an article if they tried to Retweet it without reading beyond the headline. This gives people more background in the conversations they start on the platform and was aimed at nurturing healthier conversations and improving informed participation among their audience.
As a result of these efforts, people open articles 33% more often before they Retweet them as of Q3 2020. And the platform has seen more than 15 million Tweets implementing conversational controls.
Use these Twitter stats to fuel growth
Based on these Twitter statistics, you can see that the platform has undergone massive upheaval, primarily due to the pandemic. From the conversations they engage in to how they interact with ads – Twitter users are changing the way they use the platform. So make the most of these Twitter stats to audit and revamp your social media marketing strategy.
This post 12 essential Twitter stats to guide your strategy in 2021 originally appeared on Sprout Social.