In this blog I am going to simply focus on the behavior of two of the most commonly used memory metrics in my opinion in vRealize Operations for vSphere based objects :
- Memory | Usage (%)
- Memory | Workload (%)
- Memory | Utilization (KB)
All three metrics should be nearly identical ( unless there is an issue collecting the metric from VMware Tools) and can be accessed in vROPs within the object browser on many levels such as vCenter, Datacenter, Cluster, Host and finally a Virtual Machine under the Metrics Tab -> Metrics Category -> Memory for that object.
In recent releases of vROPs the most important change related to memory metrics historically was that it utilizes the Guest | Needed Memory (KB) metric which is collected via VMware Tools from the Virtual Machines Guest OS to improve the quality of memory reporting, projections and rightsizing.
Now knowing that guest memory metrics might not be always available in vRealize Operations due to the fact that the VMware tools is old or maybe not installed or installed but not running for whatever reason, we have a failover mechanism in place to other memory metrics that I captured in the flowchart below :
( Click the Image to Enlarge )
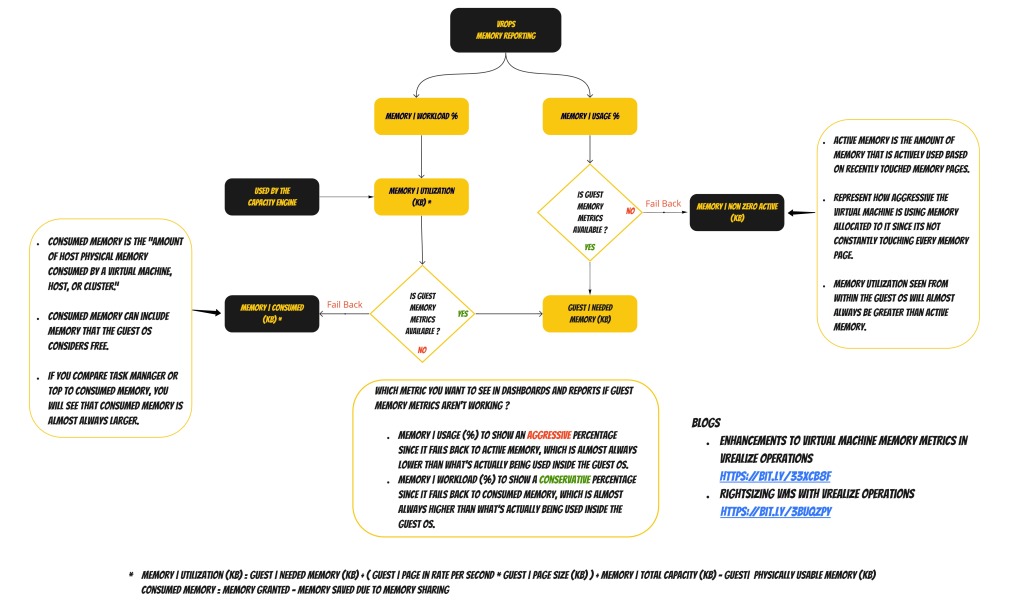
You can easily test these scenarios by stopping the VMware Tools Service on a test Virtual Machine while monitoring both the Memory | Usage (%) and Memory | Workload (%) metrics in vROPs. After that wait for 1 or 2 collection cycles and then compare the before and after results based on the failover described in the flowchart and how it impacts these metrics.
Knowing now how the built in failover works, you can decide on which metric you would want to see in your dashboards and reports if guest memory metric aren’t working for whatever reason based on and whether you want to show an aggressive or conservative percentage which I explain in the flowchart itself.
Another point here is how this might impact the memory capacity numbers on something like a Cluster level if it happens that some of the Virtual Machines in the cluster doesn’t have access to the guest memory metric, therefor the memory capacity numbers will almost always be higher than what’s actually being used inside the Guest OS for those Virtual Machines, since that Memory | Utilization (KB) metric is what the capacity engine uses and it would failback to Memory | Consumed (KB) if Guest | Needed Memory (KB) isn’t available.
That being said always make sure that VMware Tools are installed / running and that you are always using the latest version for the respected OS.
More Blogs on this topic:
- Enhancements to Virtual Machine Memory Metrics in vRealize Operations
https://bit.ly/33xcB8F
- Rightsizing VMs with vRealize Operations
https://bit.ly/3BuQZpY
Let me know in if anyone have any questions, and if you did last to the end of this blog post, I hope you found it informative.
The End Eh!


