Imagine if you could see all your vital
Google Analytics stats right in your WordPress dashboard without having to
navigate through multiple pages? Yes, now it’s possible with the GAinWP plugin,
which displays your essential Google Analytics data in a widget on your admin
home screen.
In this post, I will walk you through setting up Google Analytics tracking on your WordPress website using the GAinWP dashboard widget plugin and also explain the plugin’s primary features. By the end of this short walkthrough, you will be able to see the critical Google Analytics stats that matter in a nifty widget display right on your admin dashboard.
If you didn’t already know it, GAinWP is a fork of the popular Google Analytics Dashboard Widget Plugin (GADWP) for WordPress. ExactMetrics, which took over GADWP, modified the popular plugin beyond recognition, and it lost its primary feature: displaying the Analytics stats on a home screen widget. That’s why I set out on a journey to find the best alternative to the GADWP plugin.
Let’s get started with Google Analytics integration on your blog.
Install and activate the GAinWP plugin
Login to your WordPress admin dashboard, install and activate the GAinWP Plugin from the WordPress plugin repository.
You can now see a Google Analytics sub-menu
in your left admin panel. Go to General Settings to configure the
plugin.
Authorize the Google Analytics plugin
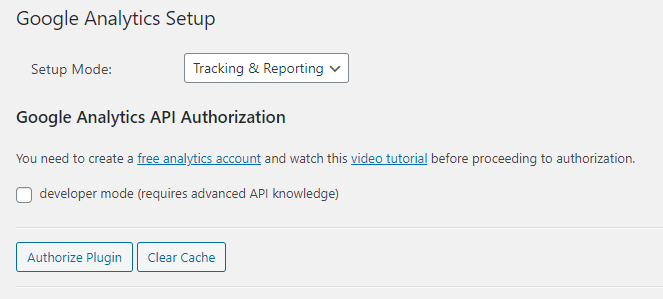
Now, you need to authorize the plugin
before you can see your juicy analytics stats on your admin home screen.

Leave the default Setup Mode to Tracking
and Reporting as we want to use the plugin for tracking the website traffic and
reporting it. Click on the Authorize Plugin button to allow it to
collect visitor data in Google Analytics.
I have assumed that you already have a Google Analytics account. If not, you should first sign up for a free account here.
Now the plugin will ask for a one-time
access code. You can click on the red link to authorize the plugin and get the
access code. Copy and paste the access code in the box and click on the Save
Access Code button.
Once you have pasted the access code, you
can see a list of your Google Analytics properties. Select your current website
name from the drop-down and click on Lock Selection.

That’s it. You have successfully configured
the GAinWP plugin to track and report your website traffic using your Google
Analytics account.
Check out your Google Analytics statistics on your home
screen
You can now see your interesting Google
Analytics user data on your WordPress admin dashboard in the form of a widget.

The GAinWP dashboard widget displays the following analytics
data:
- Sessions
- Users
- Organic views
- Total page views
- Bounce rate
- Visitor location
- Pages visited
- Referrers to your website
- Search terms used by the visitors
- Traffic sources
- Technology or the devices used to access your website
- 404 errors
The GAinWP Google Analytics reports
Now let’s dive into the reports that you
can see in your admin dashboard with the GAinWP plugin.
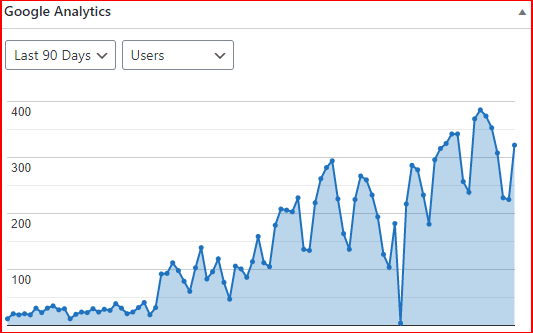
The default display in the widget is the
Sessions view. But you can choose to view the stats by Users and Page Views as
well by clicking on the icon at the top right corner of the widget.
Sessions, users, and page views
The GAinWP plugin displays the number of
sessions, users, and page views in the dashboard widget. In case you are
wondering what’s the difference between sessions, users, and page views in
Google Analytics, here’s the low down on it.

Sessions
refer to the total number of times visitors visit your website in 24 hours. A visitor
may visit and leave your site multiple times. Each visit is counted as one
session.
Users refer
to the number of unique visitors that visited your website within 24 hours, and
it does not take into account multiple visits by a user in the 24 hours.
Pageviews,
as the name suggests, is the total number of page views by the aggregate number
of visitors to your website in a 24-hour duration.
You can track these 3 Google Analytics
metrics effortlessly with this dashboard plugin. But its beauty lies in the
duration of data it shows. To see how your web traffic has grown, you can see
the traffic stats for as far back as 3 years!
For instance, I can see that the traffic to
PassionWP has surged since January 2020.

Organic views, bounce rate, and pages per session
You can also check out the number of
visitors who came from search engines like Google, Bing, Yahoo, etc. with the
Organic drop-down in the GAinWP dashboard widget.
Do you need to check out your bounce rate
and the average number of page views per session? You can see these critical
metrics at a glance. You should know that the bounce rate and the average
number of page views per session are connected.
If your bounce rate is high, your average
pages per session count will be low and vice-versa. Why is this? Because, my
friend, bounce rate is the percentage of users who left your site after
visiting a single page. So, if a high number of visitors exit your website from
the page they first landed on, without visiting any other page, the average
page view per session will also be lower.
From my dashboard widget, I can see that
89% of all traffic to PassionWP was search traffic and we have a bounce rate of
85.67%. This means two things: first, we should diversify our traffic sources,
and second, we should make concerted efforts to lower our bounce rates.
What did you make out of your Google Analytics
stats?
Location, pages visited, and referrers
These are again useful metrics to track on Google Analytics. GAinWP displays the visitor location data in the dashboard widget using an attractive world map with varying color intensities.

It also shows the number of sessions
besides each country when you hover on the country location.
Another super useful dimension that you can
check out is the Pages Visited on your site. The dashboard plugin displays not
only the page-wise traffic but also the traffic sources that sent you the visitors.

I also like to check out the Referral report in the GAinWP dashboard widget. It shows me the exact number of visitors that were referred by different websites like Facebook, Medium, Quora, etc.
Armed with this information, I can finetune
my promotion strategy and know if my marketing efforts are paying off or not.
Don’t forget the Traffic and Technology views
This is one of the most useful Google Analytics reports provided by the GAinWP plugin. This report contains information about your website traffic in four pie-charts: Traffic medium, Visitor type, Search engines, and Social networks.

The Traffic medium chart shows your website
traffic sources. The Visitor type chart segments traffic by new and returning
visitors. The Search engines chart displays the share of individual search
engines in the overall organic traffic.
Finally, you can also check out the share
of social platforms like Facebook, Quora, Pinterest, etc. in the overall social
traffic to your website.
The Technology report is also handy for
knowing information on the number of desktop and mobile visitors, the devices
these visitors used, the screen resolution, and the browser name.
Once you know this vital data, you can
optimize your website for enhanced user experience.
Summing up – GainWP provides actionable insights on your
website traffic
This is vital if you wish to use this
dashboard widget plugin to your advantage. There are hundreds of reports in
Google Analytics, but you need to separate the wheat from the chaff to make the
data work for you.
GainWP makes it happen by presenting only
the relevant metrics in a straightforward widget display right on your
WordPress admin console. Have you checked out this plugin yet, and did you find
it useful?
Please let me know in the comments below.
The post Setup Google Analytics Tracking with GAinWP Dashboard Plugin appeared first on WPBizBlog.