In the first post of this series, we covered the general idea and benefits of model-driven observability with Juju, but did not dive deep into the idea of contextualization and how it makes observability more actionable. In this post we start addressing what contextualization means in model-driven observability, starting from adding Juju topology metadata added to telemetry, and how that improves the processing and querying the telemetry for charmed applications.
The running example
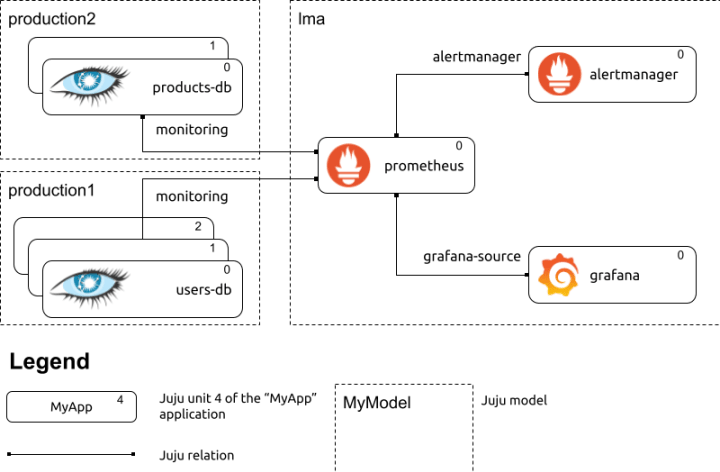
In the remainder of this post, we will use the following example as an evolution of the scenario in the first blog in this series:

In the example above, the monitoring relations between Prometheus and the two Cassandra clusters are cross-model relations. Cross-model relations connect charms in different models; for the purpose of this article cross-model relations are not materially different from relations within one model.
Juju topology, or how to uniquely identify workloads
The goal of the Juju topology is to uniquely identify a piece of software running across any of your Juju-managed deployments. This is achieved by combining the following four elements:
- model name
- model uuid
- application name
- unit identifier
Let’s go over each of them in more detail.
Model name and model uuid
Juju administrators can retrieve details of the model they are currently working on, together with other information, using the juju show-model command:
$ juju show-model
production1: name: admin/production1 short-name: production1 model-uuid: 03a5f688-a79c-4a80-8c3e-2ad3177800cc ...
The name of a model is unique within a controller, but you are likely to deploy similar, homonymous models in various controllers that operate different environments used in your software delivery process. For example, you may have one for the development environment, one for quality-assurance and one each for the various production environments. Therefore, to avoid collision in the Juju topology, we need to add the model’s Universally Unique IDentifier (UUID) to the Juju topology.
Application name
The Juju application name is easy: when deploying a charm in a model, you can optionally specify a custom name for the resulting Juju application. If no custom application name is specified, the charm name will be used as application name as well. Like models in a controller, application names are unique within a model. I virtually always specify custom application names that are meaningful in the model from the point of view of my overall system, such as naming the deployment of the database charm that will hold the user accounts “users-db”, rather than just “cassandra”. Giving custom names to Juju applications is also a way of having multiple instances of one charm in the same model, for example when your application may need multiple, separate Cassandra clusters, each serving a different use-case or for reasons of sandboxing data access for easier governance.
Unit identifier
When you deploy a charm, you can effortlessly scale it up and down. Each instance is called a unit. One of the many design decisions of Juju that I love (more on this later) is that units have a fixed, predictable identity: when you scale a Juju application to, say, three units, each instance has a stable identifier built on the Juju application name and an ordinal number starting from zero, for example “users-db/0”, “users-db/1” and “users-db/2”. When one of the units is restarted, because its charm is updated, or it crashes, a new unit with the same identifier takes its place! This also has implications when scaling down a Juju application: when scaling down the users-db application from three units to two, you know that the “users-db/2” application is getting the boot. (By the way, the predictability in terms of which unit is scaled down is a very nice property of Juju in terms of software operations.)
Tying it all together
In our example, the three units of the “users-db” application are uniquely identified as:
{ juju_model="production1", juju_model_uuid="1234567", juju_application="users-db", juju_unit="users-db/0" }
{ juju_model="production1", juju_model_uuid="1234567", juju_application="users-db", juju_unit="users-db/1" }
{ juju_model="production1", juju_model_uuid="1234567", juju_application="users-db", juju_unit="users-db/2" }
You will have immediately noticed that the syntax we used above is the one of Prometheus labels, and that is a foreshadowing.
Intermezzo: Entity stability
As an aside, before joining Canonical I worked at an Application Performance Management company. The tool is built around the concept of entities, like a process, a cluster or a (virtual) host. One of the key problems in that domain is what we called entity stability, that is, giving a consistent name to your HTTP server across restarts. Entity stability is far, far harder to solve for a monitoring tool than it sounds: when a Java Virtual Machine goes away and another appears on the host the next time the tool checks, you cannot quite tell whether they are the “same” process in the mental model of the user.
Entity stability is actually not solvable in general, and requires bespoke work and approximations for every new technology that must be monitored. Left unsolved, it makes it really hard to provide historical data for the various parts of your infrastructure across the changes that occur over time. As discussed in the previous section, Juju solves this problem out of the box, and when I saw that, I was simply blown away.
Adding Juju topology to metrics
Considering the the running example, the following configuration snippet, focused on the Prometheus server running in the prometheus Juju application is generated automatically by the Prometheus charm based on the relations in the Juju model:
scrape_configs:
- job_name: juju_production1_1234567_users-db_prometheus_scrape honor_labels: true relabel_configs: - source_labels: [juju_model, juju_model_uuid, juju_application, juju_unit] separator: _ regex: (.*) target_label: instance replacement: $1 action: replace static_configs: - targets: - 10.1.151.128:9500 labels: juju_application: users-db juju_model: production1 juju_model_uuid: 12345678-0c91-46a7-8843-d3695e4dad9a juju_unit: users-db-0 - targets: - 10.1.151.114:9500 labels: juju_application: users-db juju_model: production1 juju_model_uuid: 12345678-0c91-46a7-8843-d3695e4dad9a juju_unit: users-db-1 - targets: - 10.1.151.109:9500 labels: juju_application: users-db juju_model: production1 juju_model_uuid: 12345678-0c91-46a7-8843-d3695e4dad9a juju_unit: users-db-2
Notice how the scrape configuration ensures that the Juju topology is applied correctly to all scraped metrics by adding the required labels to each item in the “static_configs”‘s targets. Moreover, the “honor_labels” configuration set to “true”, means that if the metric already comes in with annotated Juju topology, Prometheus is not going to override it. This behavior will come in handy when, in a later post in this series, we cover how to monitor with Prometheus software that is not run by Juju.
Contextualized metrics and their power
So, what can “Juju topology” do for us? Well, as it turns out, a lot. Contextualization in model-driven observability consists of annotating telemetry and alerts with consistent, actionable information about which system generates them. After all, a spike in the metric reporting the query latency usage across a database cluster may either make your pager ring at 3AM at night, or wait until the third coffee tomorrow morning depending on whether the spike takes place in production or in the testing environment.
Metrics continuity
Pods can terminate or crash, and Kubernetes will bring up replacements automatically. For Prometheus, however, the identity of where a metric comes from is largely a matter of the instance label. Prometheus will automatically add the instance label to all scraped metrics, setting its value to the network address and port of the scraped endpoint, e.g. “1.2.3.4:5670”. However, when a pod is recreated, it may have a different IP address, and the “same” metric collected by the newly recreated unit may count for Prometheus as an entirely different metric.
This is not an issue with Juju! In the Prometheus configuration shown in the previous section, there is a very interesting bit that addresses this problem directly:
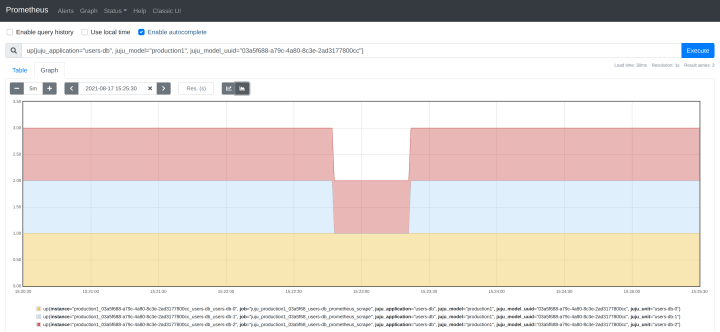
relabel_configs: - source_labels: [juju_model, juju_model_uuid, juju_application, juju_unit] separator: _ regex: (.*) target_label: instance replacement: $1 action: replaceThe configuration overrides Prometheus’ default instance label value with a combination of the Juju model, model_uuid, application and unit. In other words, the instance label is built from the Juju topology, and therefore the value of the instance label is stable across unit recreation. The outcome is that, when a Juju unit is recreated, your metrics picks up with the new unit precisely where it stopped with the old unit.

The value of this continuity of metrics cannot be overstated: over charm updates, configuration changes, issues that make a unit crash, even model migrations (when you move a Juju model and its apps from, say, one Kubernetes cluster to another), the history of your metric is preserved. Imagine the case of upgrading the Cassandra cluster: all units get recreated, one after the other, and you can handily spot potential issues with unit granularity, just by looking at your Prometheus dashboards, no complicated grouping or mapping required. It’s easy and intuitive, and it reduces the complexity of writing PromQL queries a lot: in practice, we seldom ever need to use vector matching operators to analyze metrics over restarts or upgrades, and if you have used PromQL with Kubernetes without the Juju topology, you will appreciate the difficulties this eliminates!
What’s next
With metrics continuity, we have just begun scratching the surface of all the good that comes with annotating Juju topology on telemetry.
The first post of this series covered model-driven observability and its benefits from a high-level perspective.
The following installments of this series will cover:
- The benefits of Juju topology for grouping alerts in Alertmanager
- The benefits of Juju topology for Grafana dashboards
Moreover, I will start covering the perspective of charm authors, by discussing:
- How to bundle alert rules with your charms, and have those automatically evaluated by Prometheus
- How to bundle Grafana Dashboards with your charms, and let Juju administrators import them in their Grafanas with one Juju relation
Meanwhile, you could start charming your applications running on Kubernetes. Also, have a look at the various charms available today for a variety of applications.
Also, Canonical recently joined up with renowned experts from AWS, Google, Cloudbees and others to analyze the outcome of a comprehensive survey administered to more than 1200 KubeCon respondents. The resulting, insightful report on the usage of cloud-native technologies is available here:
Kubernetes and cloud native operations report 2021
