In the first post of this series, we covered the general idea and benefits of model-driven observability with Juju. In the second post, we dived into the Juju topology and its benefits with respect to entity stability and metrics continuity. In this post, we discuss how the Juju topology enables grouping and management of alerts, helps prevent alert storms, and how that relates with SRE practices.
The running example
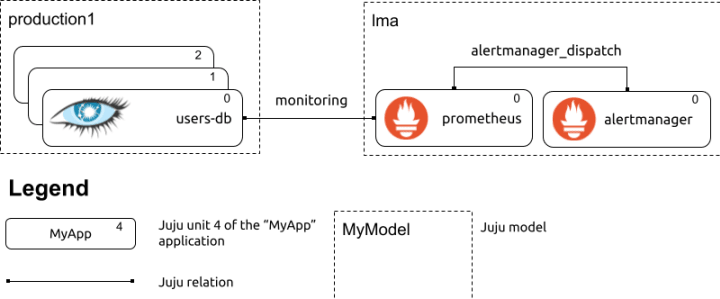
In the remainder of this post, we will use the following example:

In the example above, the “monitoring” relation between Prometheus and the Cassandra cluster results in Prometheus scraping the metrics endpoint provided by the Cassandra nodes. The cassandra-k8s charm, when related to a Prometheus charm over the “monitoring” relation, automatically sets up Instaclustr’s Cassandra Exporter on all cluster nodes, and the resulting metrics endpoints are scraped by Prometheus without any manual intervention by the Juju administrator beyond establishing the “monitoring” relation. (This kind of magic user experience is what we refer to as “low toil” in model-driven observability.)
What are “alert storms” and how do they brew?
Software inevitably fails and, when it does (or ideally some time before it does), your observability stack will alert you. But failures cascade through systems, and one root cause ends up having many symptoms on different related systems and, as such, many alerts are fired. When the alerts fired at your pager are many and more keep coming in, you have an alert storm. Colloquially, an alert storm is that phenomenon that occurs when multiple interrelated alerts get triggered in quick succession. Often, these alerts have a common cause, or they are at least closely related. For example: imagine that a Cassandra cluster goes down that alone will trigger one or more alerts in the monitoring of the cluster, and very likely alerts from the applications that rely on that cluster.This means that alerts spread to the applications that rely on the applications that rely on the Cassandra cluster and before you know it, everything looks like it is on fire and it becomes difficult to identify a starting point for the troubleshooting.
Alert storms have severe short and long-term implications for the teams facing them. In the short-term, a continuously-firing pager distracts you while you are fire-fighting, and it feels like someone is pouring gasoline on a bonfire. Then there is the cognitive overload of deciding which fire to put out first, trying to discern cause from effect, and decision making under duress is not trivial. Long-term, teams develop alert fatigue: the more alerts one is exposed to over time, and the less meaningful each of those alerts is (“Yes, I already know the cluster is bricked!”), the less likely the operators will be quick to jump to the firefighting (“That thing is borked more often than not anyhow”). Over time, issues get underestimated or outright overlooked. Beyond the dip in operational readiness, alert fatigue has serious personal implications for the people experiencing it.
Speaking with hundreds of practitioners over the past few years first as a performance expert and Application Performance Management (APM) advocate, and more recently as a Product Manager of a contemporary APM solution, I have seen ample evidence that the increasingly distributed nature of production systems has wrought a progressive but significant increase in the number and severity of alert storms experienced by teams, largely irrespective of the software they operate (or its criticality). Fortunately, this is something that the ongoing work around model-driven observability with Juju can tackle! As we discussed before, alert storms are emerge from:
- Multiple, redundant alerts from the same subsystem (e.g., a Cassandra cluster) firing due to the same cause.
- Issues spreading “upstream” from the systems experiencing issues to the systems that depend on them.
In the next section, we discuss how Juju topology easily tackles (1). Item (2) is discussed in “The long-term perspective on alerting and Juju” section.
Managing alerts based on the Juju topology
In the previous post of this series, we defined the concept of “Juju topology” as “uniquely identify[ing] a piece of software running across any of your Juju-managed deployments” and using that metadata to annotate telemetry. We discussed how to annotate the Juju topology with Prometheus, but the very same concept applies to all other types of telemetry, including logs and, as we are going to discuss in the remainder of this post, alerts.
Alert groups
Alertmanager has a grouping function that, when correctly configured, enables operation teams to avoid, or at least largely reduce alert storms. Groups in Alertmanager are a way to “avoid continuously sending different notifications for similar alerts”. Notice just how much work the word “similar” does in that sentence: the key to avoiding an alert storm with notifications continuously tripping your pager is to have an effective definition of similarity for alerts.
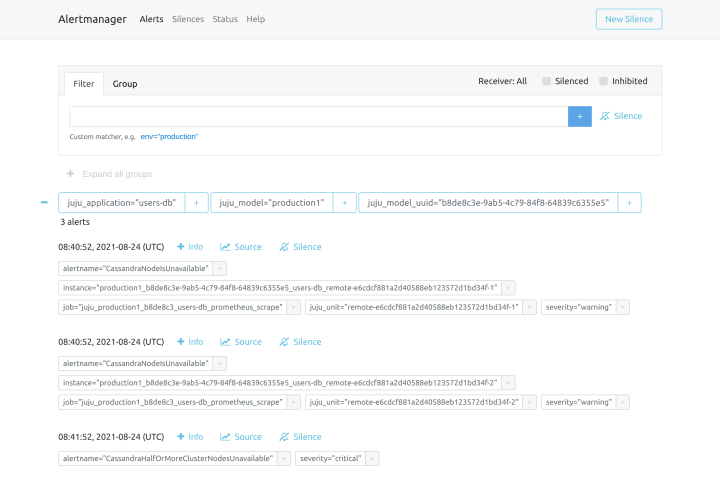
Out of the box, the Juju topology gives us a workable, general definition of similarity for alerts: two alerts are similar when they regard the same system. While it may sound simplistic at first, in reality grouping alerts by the system that caused them is a proven way of cutting down or mitigating alert storms and providing a bird’s eye perspective of which systems are malfunctioning.

The image above shows alerts in Alertmanager grouped on the basis of the Juju topology of the system that originated them. This is achieved by using Juju topology tags in the group_by configuration of an Alertmanager route. Routes in Alertmanager are fundamentally a decision tree of what to do with an alert coming into the system. (The “Life of an Alert” talk by Stuart Nelson is truly excellent at explaining how alerts are processed by Alertmanager). To group alerts based on the Juju topology, all it takes is to have the following root route:
route: group_by: - juju_application - juju_model - juju_model_uuidIt is worth noting that, despite the Juju topology also containing the “juju_unit” label, it is not used for grouping. Rather, it is convenient to group alerts by the Juju application, rather than single units. Issues with clustered applications, which form the majority of multi-unit charmed applications, tend to be correlated. For example, as a result of issues in the underpinning or surrounding infrastructure.
Of course, there is much more to a production-ready setup of Alertmanager than one route, like additional routes to further refine which alert is notified where (email versus a webhook versus a SaaS pager system), but this first bit is all it takes to significantly mitigate alert storms on Juju-managed infrastructure!
Alert silences
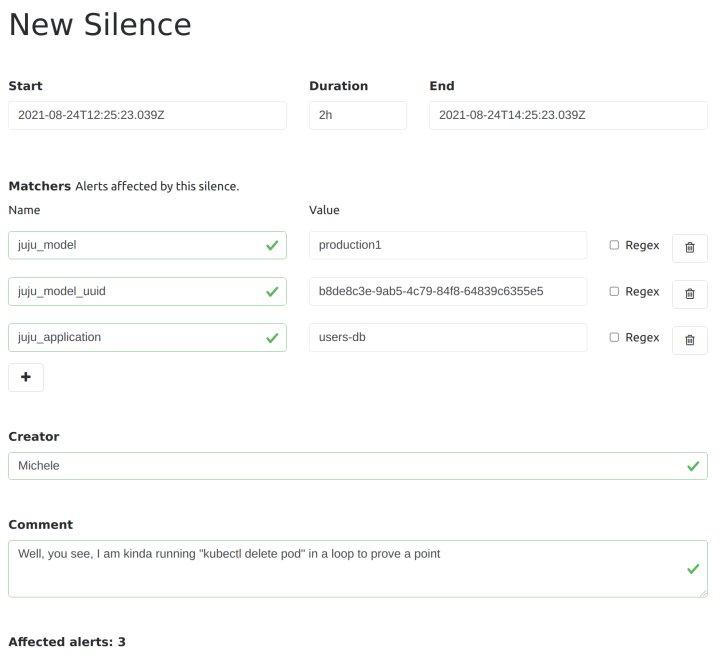
Besides grouping alerts, Alertmanager has another functionality, called silences, that you can use to mute for a short time the firing of new notifications. Silences are meant to avoid distraction during the troubleshooting of known issues or during maintenance windows. Silencing rules are specified as matchers on alert labels, so it is pretty easy to avoid new alerts from a problematic application with something like this:

The long-term perspective on alerting and Juju
As discussed earlier, many types of issues spread across systems through dependencies: increased load on a web server may cause overload in a database, and if that database is shared by other applications, they in turn could experience issues in terms of increased latency of failures.
The declarative nature of Juju and the explicit dependency modeling intrinsic in Juju relations gives us all the right ingredients to model how alerts spread across various components of a system. Juju relations are semantic in nature: a charm describes what it needs via a relation interface like “cql” (for: “I want a cluster I can speak Cassandra Query Language with”) and the intent is codified in the relation name, e.g., “users-database”.Something I have been mulling over, is how to use the information encoded in Juju relations to define grouping or, maybe, inhibit rules in Alertmanager, so that alerts across dependencies are grouped together as likely correlated. This kind of topology-oriented alerting is sometimes found in commercial APM tools, usually based on distributed tracing telemetry (which is also something I am very much looking forward to bringing to model-driven observability in the future!).
What’s next
With alert grouping, we start tapping the operational benefits of Juju topology for observability, but there is much more to come. The following installments of this series will cover:
- The benefits of Juju topology for Grafana dashboards
- How to bundle alert rules with your charms, and have those automatically evaluated by Prometheus
- How to bundle Grafana Dashboards with your charms, and let Juju administrators import them in their Grafanas with one Juju relation
Meanwhile, you could start charming your applications running on Kubernetes. Also, have a look at the various charms available today for a variety of applications.
Also, Canonical recently joined up with renowned experts from AWS, Google, Cloudbees and others to analyze the outcome of a comprehensive survey administered to more than 1200 KubeCon respondents. The resulting insightful report on the usage of cloud-native technologies is available here:
Kubernetes and cloud native operations report 2021
References and further reading
There are many good resources about best practices around monitoring in general and alerting in particular. Some of my very favourites, and excellent places to start learning, are the following:
- “My Philosophy on Alerting” and “Monitoring distributed systems” by Rob Ewaschuk
- “Practical Monitoring” by Mike Julian
Other posts in this series
- Part 1: Modern monitoring with Juju
- Part 2: The magic of Juju topology for metrics
