The end-to-end monitoring of complex software systems is difficult, toil-intensive and error-prone. Developers, SREs and Platform teams must continuously invest effort in setting up and maintaining the monitoring setups that underpin the observability of their systems, or accept the risk of being unaware of ongoing issues and their impact on end users. Enter model-driven observability powered by Juju!
Juju is a framework for opinionated “charmed operators”, colloquially called charms, that manage other software, like your databases, applications and other infrastructure components (including Kubernetes, OpenStack and LXD). Juju is declarative and model-driven, allowing you to compose charms and the relations between them in expressive, reusable and portable models.
This post, the first of a series, provides a first glimpse at a new generation of observability charms for Juju, and how they can drastically simplify the monitoring setup for systems, reduce its ongoing maintenance costs and, at the same time, contextualize and enhance the actionability of the collected telemetry.
The benefits of model-driven observability
Model-driven observability based on Juju optimizes the benefits of modern OSS observability by adding to the mix the following ingredients:
- Low toil: setting up observability for a new application is a simple matter, with a limited amount of work to be performed in the charm for the application, which can utilise the intelligence and functionality in the surrounding charm ecosystem.
- Intuitive: Which application is monitored where and how, is encoded in the Juju model and immediately understandable for humans even in complex deployments.
- End-to-end automated: Charms do the heavy lifting for you. As a Juju administrator, you select which charms you want to run, relate them with one another to achieve higher-order functionality, and your deployment is good to go!
- Repeatable: Juju models are portable and reusable. The same simple patterns can be applied to new deployments and new infrastructures with predictable, reliable results.
- Contextualized: Juju models express a topology of software. Each piece of each application managed by Juju is uniquely identified in terms of its name, its running instances (called units in Juju) and the Juju model it belongs to. The charmed observability stack automatically enriches telemetry with metadata that describes the Juju topology, for example as Prometheus metrics labels, which unlocks grouping, filtering and other analysis capabilities with no additional effort.
Moreover, as the Juju charm ecosystem evolves and expands, your deployments will grow more and more capable over time, with more integration possibilities coming online and further toil removed from your desk.
Model-driven Prometheus monitoring
Let us look at one of the scenarios that is currently under development in the ecosystem of Kubernetes-based charms: monitoring other charms with Prometheus, Alertmanager and Grafana.

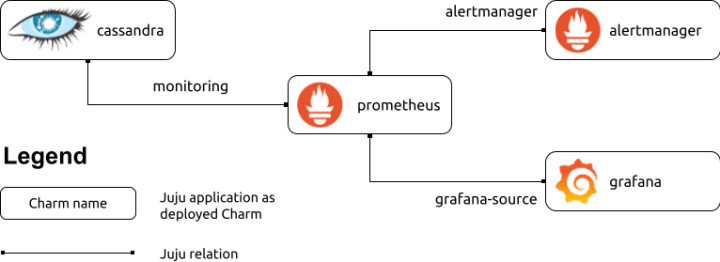
Above you see a representation of a Juju model running a Cassandra cluster, monitor via Prometheus, with alerts routes to Alertmanager and dashboards displayed in Grafana. An administrator can take in this intuitive overview in seconds and understand what it means. To set this up, assuming you already have Prometheus, Alertmanager and Grafana set up (which is equally simple), all it takes for a Juju administrator is simply:
$ juju deploy cassandra-k8s cassandra
$ juju add-relation cassandra:monitoring prometheus
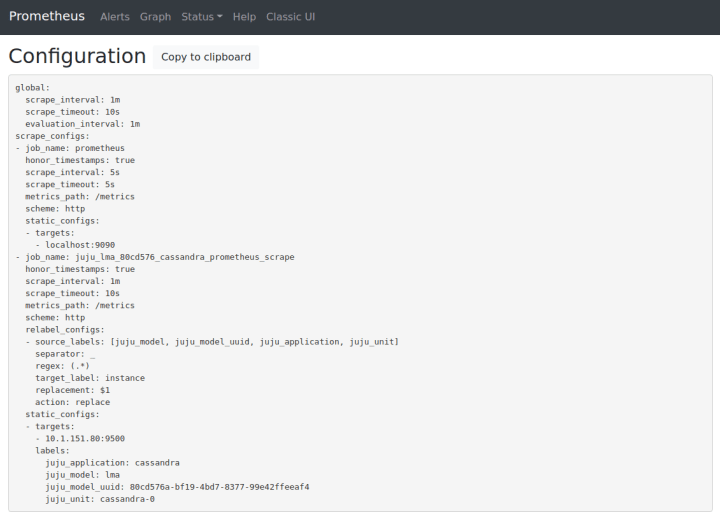
And that’s it, low toil as promised! Juju downloads the necessary charms from Charmhub, the automation kicks in and Juju starts deploying and configuring the software. The Prometheus charm automatically generates the scrape configuration based on the data provided by the Cassandra charm over the monitoring relation, and metrics start flowing! (And, soon, alert rules specified by the cassandra-k8s charm; look out for another blog post of this series.)

Besides, notice how there is nothing infrastructure-specific in these steps we performed: you can repeat the pattern across as many Kubernetes clusters as you would like, and it would still look every bit as simple and work as well.
Of course, the same Prometheus, Alertmanager and Grafana deployed charms can monitor other charm-operated applications at the same time: all it takes is to relate those other charms with the same Prometheus similarly to what we did with Cassandra.
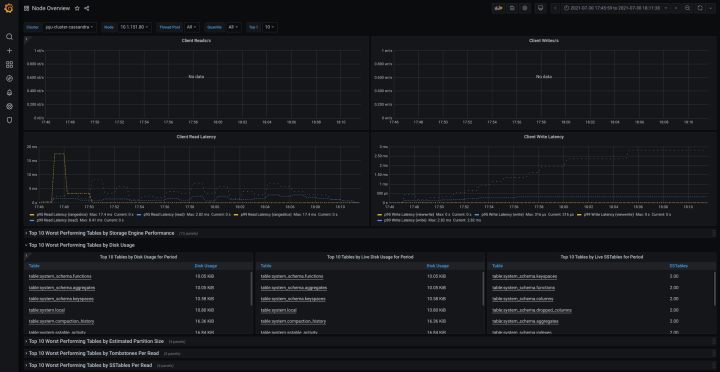
Then you can jump into Grafana and start creating dashboards using all metrics that Prometheus scrapes for you from Cassandra. Easy as pie ?

What’s next
In the next few weeks we will show you more of our ongoing work on model-driven observability including how to:
- contextualize the telemetry collected by the Prometheus charm with information about the Juju models, applications and units, and how that grants desirable monitoring properties like timeseries continuity across application restarts and upgrades seamlessly
- bundle Grafana Dashboards with your charms, and let Juju administrators import them in their Grafanas with one Juju relation
- bundle Prometheus alert rules with your charms, and have those automatically evaluated by Prometheus by virtue of the prometheus_scrape relation
Meanwhile, you could start charming your applications running on Kubernetes. Also, have a look at the various charms available today for a variety of applications and use-cases.
Also, Canonical joined up with renowned experts from AWS, Google, Cloudbees and others to analyze the outcome of a comprehensive survey administered to more than 1200 KubeCon respondents. The resulting, insightful report on the usage of cloud-native technologies is available here:
Kubernetes and cloud native operations report 2021
