Optimizing your Instagram presence doesn’t have to be a guessing game. You can find most of the answers you need within the app itself.
Anyone with an Instagram Business account can use the network’s in-app reporting feature, Instagram Insights. While it may not provide the same level of detail as an advanced Instagram analytics tool, it’s still a valuable resource for conducting on-the-fly analysis.
This guide will show you how to access and use Instagram Insights to analyze your data. We’ll also share how to use the tool in combination with an advanced social analytics solution to drive results faster.
- What is Instagram Insights?
- How to get access to insights on Instagram
- How to see post insights on Instagram
- Instagram Posts insights
- Instagram Reels insights
- Instagram Stories insights
- Instagram Live insights
- What kind of performance data is available in Instagram Insights?
- Using Instagram Insights for performance analysis
What is Instagram Insights?

Instagram Insights is a free Instagram Business Account feature that offers performance data on your profile and posts, providing enhanced visibility into your audience’s preferences and engagement patterns.
With Insights, you can measure the success of your content, including grid posts, Stories, Reels and Live videos. It’s a valuable tool for evaluating the impact and effectiveness of your Instagram marketing strategy.
How to get access to insights on Instagram
Before we get into how to use the Insights tool, let’s go over how to access them. Heads up: This is a mobile-exclusive feature, so you’ll need the app ready to go before you get started.
1. Go to your profile settings
Go to your profile, then tap the hamburger menu in the top right corner of the app. Tap Settings and then tap Account to get started.
2. Create a professional account
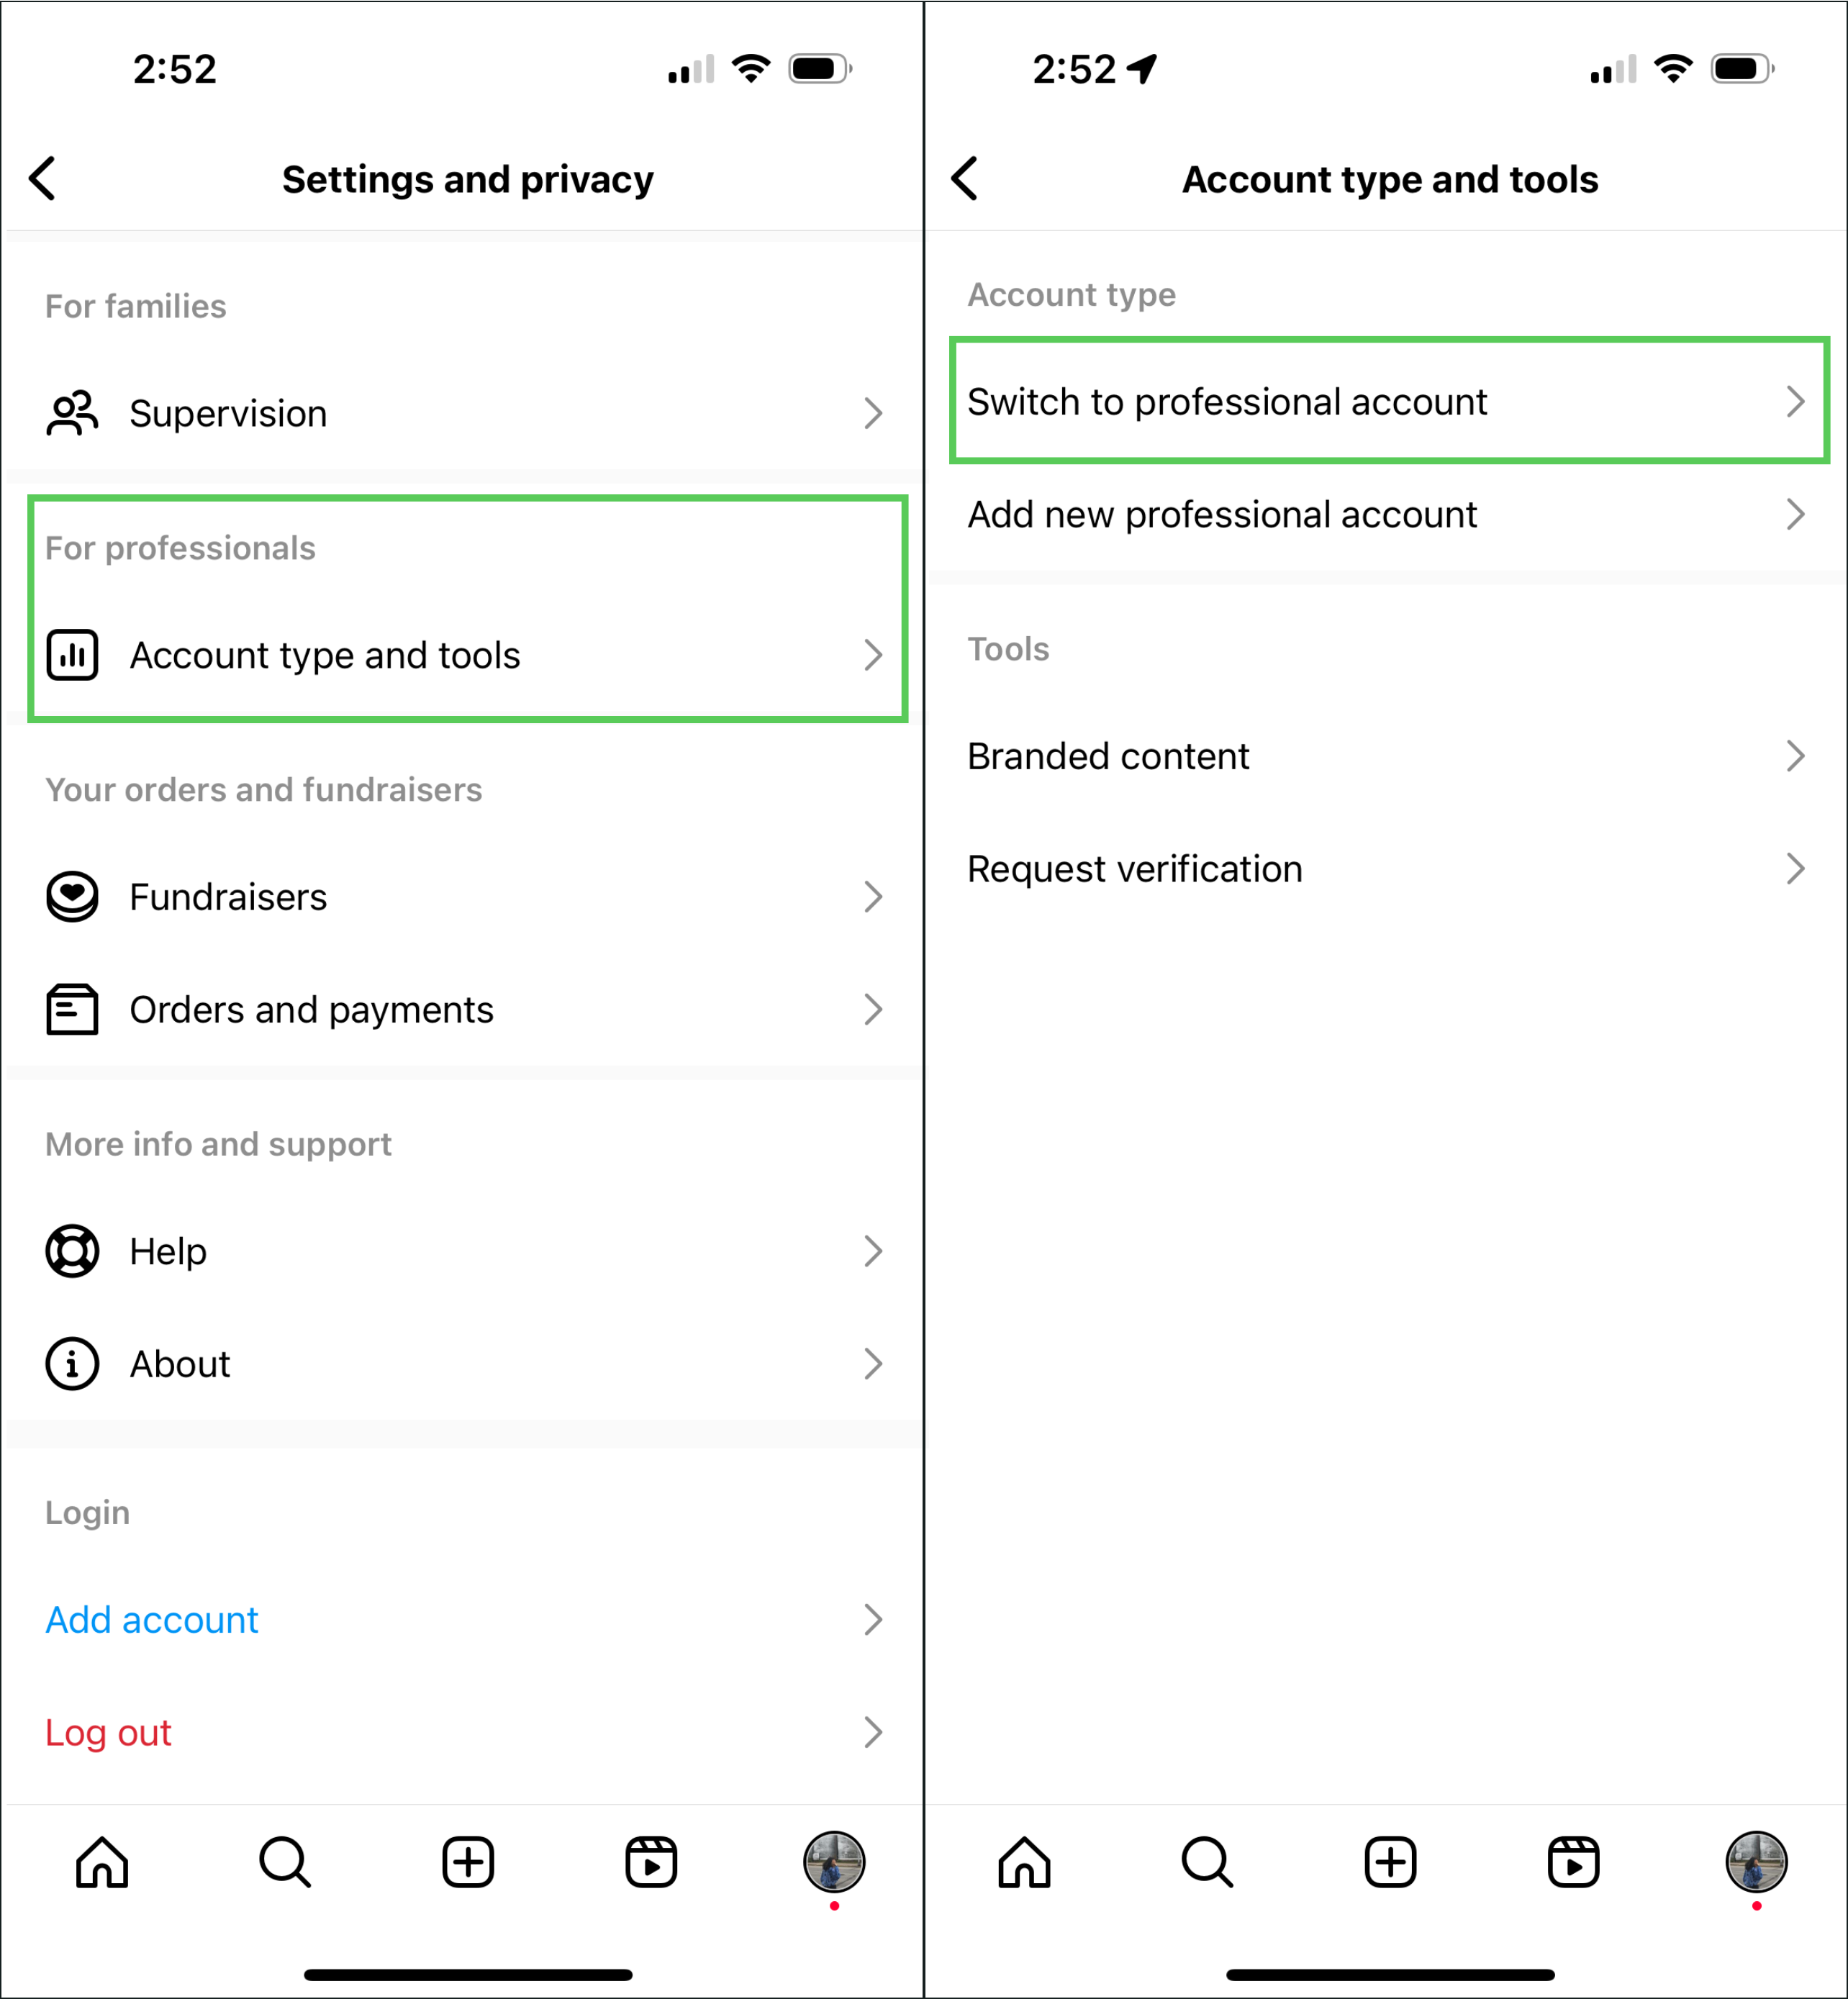
To set up your Instagram for Business account, tap Account type and tools under the For professionals section of the Instagram Settings page.

Tap Switch to professional account and you’re ready to go.
3. Choose your category
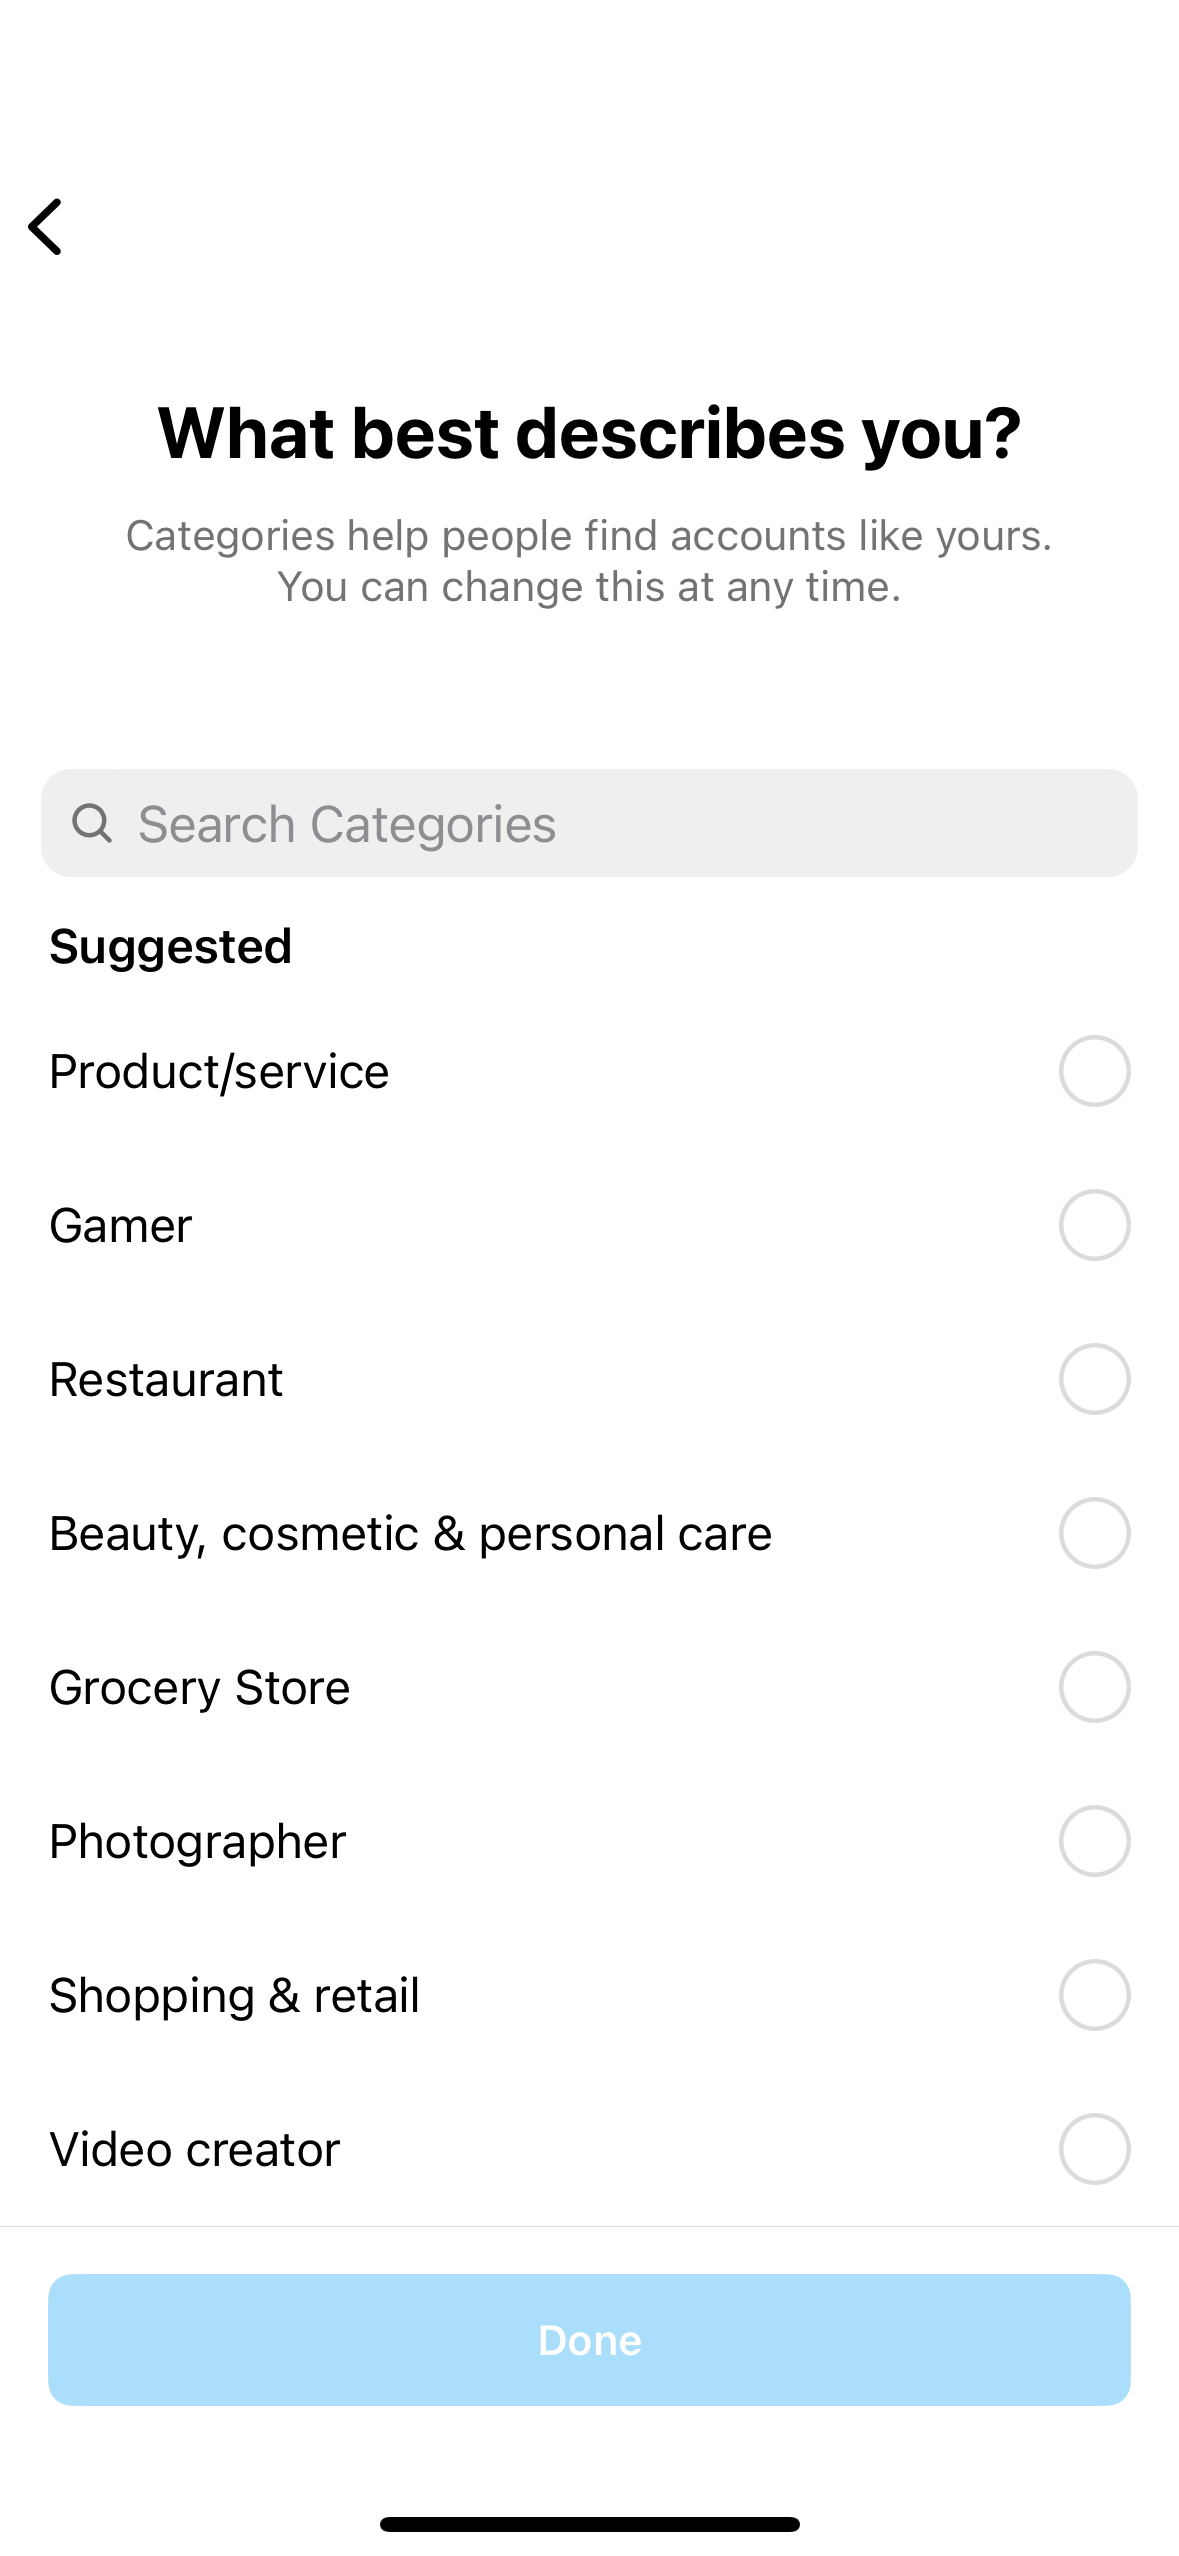
Instagram business categories allow brands to clearly showcase the purpose of their business above their profile description. Choose the category that best describes your business.

Pro tip: The options listed under the suggested categories are just a fraction of the full catalog you can pick from. Use the search function to find the option that best suits your business, and don’t be afraid to get specific.
4. Navigate to Insights
Now that your professional account is all set up, you can access Insights from the same hamburger menu you used for your account settings.
You can only access performance metrics on content you’ve posted since converting to a business or creator account. If you recently switched to a professional account, you’ll have to wait until it has enough historical data to use the Insights tool.
How to see post insights on Instagram
Instagram offers a variety of ways to connect with your audience—grid posts, ephemeral content, short-form video, live streams, you name it.
To find out if your Instagram post ideas are resonating, check out the explainers below.
Instagram Posts insights
Go to your Instagram profile and tap a post you’d like to get metrics for. From there, tap the View Insights button below the image.

Instagram Reels insights
To view insights on an Instagram Reel, go to the Reels tab of the Instagram app.
From there, select the Reel you’d like to view metrics for. On the lower right-hand side of the Reel, tap the … icon. Then, tap the Insights button.

Instagram Stories insights
There are two different ways to view insights on Instagram Stories.
If the Story is live on your account, tap your profile picture. Tap through to the Story you’d like to report on. Once you’re there, swipe up on the image or video for Insights metrics.
If you’re looking for performance data on an older Story, tap the Insights action button on your profile and find the Story under Content You Shared.

Instagram Live insights
To view Instagram Live insights, go to your profile.
Tap Insights, then scroll down to the live video section in the content you’ve shared for a detailed breakdown on your Instagram Live performance.
What kind of performance data is available in Instagram Insights?
Once you navigate over to the tool, you’ll see some high-level Instagram audience insights and a gallery of recently shared content.

Click into either section for a more detailed look into the following metrics:
Accounts reached
For all Instagram content aside from Reels, accounts reached is the number of unique accounts that have seen your posts on their screen at least once. For Reels, accounts reached means the number of unique accounts who have seen your Reel at least once, whether or not they watched the video.
Once a post has reached more than 100 accounts, you can access demographic data on accounts reached. This data includes top countries, cities, age ranges and a gender breakdown.

Accounts engaged
Accounts engaged is the number of unique accounts that have interacted with your Instagram content through likes, saves, comments and other engagement activities. For posts, stories and Instagram Live, these metrics are drilled down into followers and non-followers.
Total followers

Business accounts with more than 100 followers can view overall trends in growth over time. They can also access follower demographic and platform usage data, including:
- Top locations
- Age range
- Times your audience is most active on Instagram
Plays
Plays is the number of plays video content received within a set time frame. That includes when a video plays automatically while a user scrolls through the app.
Using Instagram Insights for performance analysis
To take your Instagram game to the next level, you need to be making data-driven decisions. Luckily, you now have a wealth of performance data right in the palm of your hand.
Here are four ways to use your new Instagram business insights to your advantage:
Identify popular content
With Insights, you can quickly identify the content that resonates most with your audience. All you need to do is look for patterns in what your audience finds compelling and tailor your content strategy accordingly.
For on-the-fly action items, we recommend conducting a brief start-stop-continue analysis of your Instagram performance data. This analysis evaluates the effectiveness of content and determines what actions to start, stop or continue.

It’s important to note that this type of spontaneous analysis is designed to provide quick takes on your Instagram strategy’s effectiveness, such as whether people reacted positively to a particular post.
For more complex questions, like determining the best time to post on Instagram, you’ll want to use a more advanced social media management tool. For example, Sprout customers can take advantage of ViralPost® technology, which analyzes audience engagement patterns and content preferences to detect the most active times for authentic engagement.

Track growth and engagement trends
A quick dip into the Insights tool is all you need to do to ensure you’re pacing well toward your monthly performance targets. If you happen to notice any inconsistencies, use Sprout’s suite of Instagram analytics reports to investigate the issue and its potential causes.

Use the Instagram Business Profiles Report to identify which types of content are driving results. That way, you can make strategic adjustments to stay on track toward achieving your desired outcomes.
Make stronger paid marketing decisions
Did you know that 50% of users become more interested in a brand after seeing an ad for it on Instagram? With these types of results, making every dollar count is critical.
Use Instagram Insights to optimize your paid performance so you can make better use of your budget.
Analyze your organic content performance to identify trends, themes and creative elements that resonate with your audience. Then, leverage that data to take your paid marketing efforts to the next level.
Gauge the impacts of an algorithm shift
An Instagram algorithm update feels like a monthly occurrence at this point. Keeping up with all the changes is one thing. Understanding how they impact your social media strategy is a different beast entirely.
Next time you hear about a rumored or confirmed algorithm update, use Instagram Insights to see how your strategy is weathering through the change. If everything is going according to plan, then you’re good to go. If you notice any performance dips, it’s time to investigate further using a tool that can provide a more comprehensive analysis.
Use Instagram Insights to create a picture-perfect social strategy
Instagram’s landscape is constantly changing. Trends come and go quickly, and what’s popular today may not be tomorrow. Use Instagram Insights in combination with a tool like Sprout to stay informed and up-to-date on what works and what doesn’t.
Of course, data is only part of the story. For practical advice on building your brand identity and expanding your community on Instagram, check out this comprehensive guide to Instagram for brands. It’s packed with valuable tips to help you achieve your platform goals.

If it suddenly feels like the Instagram algorithm is out to get you, review your past few monthly reports. If you’re posting at the same frequency and with the same content mix, it may be time to adjust your strategy.


Luckily, providing timely responses is half the battle. If you want to speed up your Instagram DM response times, use Sprout’s Inbox Activity Report to better understand your average time to first response. For more on a winning Instagram DM strategy, check out these tips from the social media support team at MeUndies.

You could record how many followers your brand profile has at the end of each month, but this can create an incomplete picture of audience growth. For a more comprehensive view of how your audience is evolving, you’ll want to track both followers gained and followers lost. This gives a more accurate understanding of what’s attracting people to your brand, and what might be pushing them away.

These will guide you toward stronger, more informed decisions for your Instagram strategy.
Pro Tip: If you’re using Sprout’s Report Builder, you can use the Text Asset feature to weave this analysis into your monthly reports.

For better results, use a hashtag analytics tool to identify which hashtags are best aligned with your marketing goals. Soon, you’ll be able to spot growing hashtags that will increase the discoverability of your content with the right audience.

Eighty percent of consumers say that brand familiarity makes them more likely to buy on social. If you use Instagram’s shopping features, track impressions alongside sales to determine how brand awareness impacts your social commerce strategy.


Social listening can help you speed up your vetting process. Next time you spot a hot topic, try conducting a social listening analysis to learn more about what’s driving the conversation and how people feel about it. You may find that the opportunity is worth rearranging your scheduled content for.


Use your organic performance to inform your paid ad strategy. If a piece of content lands particularly well on its own, it’s more likely to hook new audiences when served as an ad. As you continue refining your strategy, you’ll soon have enough data to establish a feedback loop that benefits your organic and paid performance.

You can audit your profile, your followers or your branding, but for now, we’re going to focus on your Instagram analytics set up. As you look through your reports, review them from an outsiders perspective. Do they tell a clear story? Do they lead with the most important insights?

Sprout’s Campaign Planner lets you quickly identify your best-performing content so you can quickly determine what’s best supporting your campaign goals. Use it in tandem with the Tag Performance Report for deep insights on the overall effectiveness of your Instagram campaigns.

Use taps, exits and replies to uncover insights into your audience’s content preferences. If a story has people tapping backward to reply, that content may deserve a spot on your grid. To find more information on your Stories performance in Sprout, check out the Instagram Business Profiles Report.

If you have a burning question about what will strike a chord with your community, try conducting an A/B test. For conclusive results, be sure to design it around specific, measurable metrics. If you’re conducting tests manually, here’s a creative testing worksheet that can help you track your results.

If you want to get the most out of your UGC efforts, use your Instagram analytics tool to learn more about what style of content drives the most engagement. Use that information to create content or a branded hashtag that encourages your fans to create content inspired by your campaign.

umber of people who have watched your video) and watch rate (how much time people spend watching your video).

If you want to rely on benchmarks, our research found that the best times are Tuesdays from 11 a.m. to 2 p.m. and Monday through Friday at 11 a.m. But if you want to rely on your audience insights, you’ll need an Instagram analytics tool. Sprout’s ViralPost® drills down into how your posting time influences your social performance across networks to provide you with tailored recommendations on when to publish.
