With billions of mobile users nowadays, building websites that are viewable on mobile devices is indispensable. Luckily, we’ve got many tools and options for debugging websites on mobile platforms.
If you are developing solely in an macOS and iOS environment, you may not need those third-party tools. Apple has already provided a set of tools for the job.
And In this post, we’ll show you how to utilize them to access and debug static websites as well as WordPress websites in iOS for iPhone and iPad.
Without further ado, let’s get started.
Recommended Reading: Mobile Emulation In Google Chrome
Getting Started
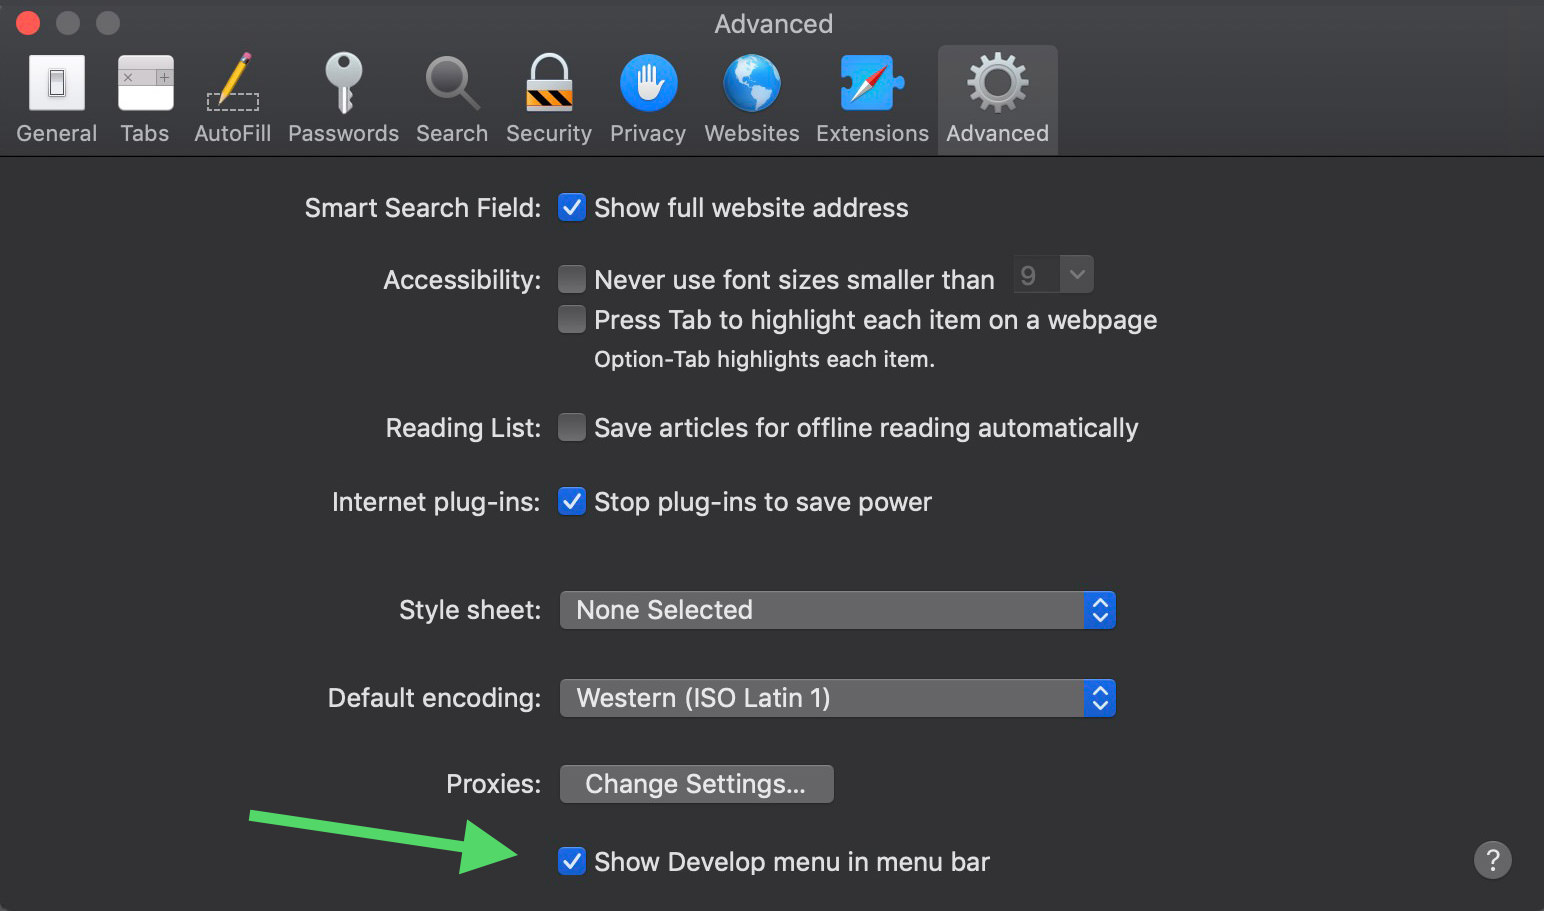
First, launch Safari and enable the Developer Tools via Safari > Preference. In the Advanced tab, tick the Show Develop menu in menu bar option.

A new menu called Develop will appear in the Safari menu bar.

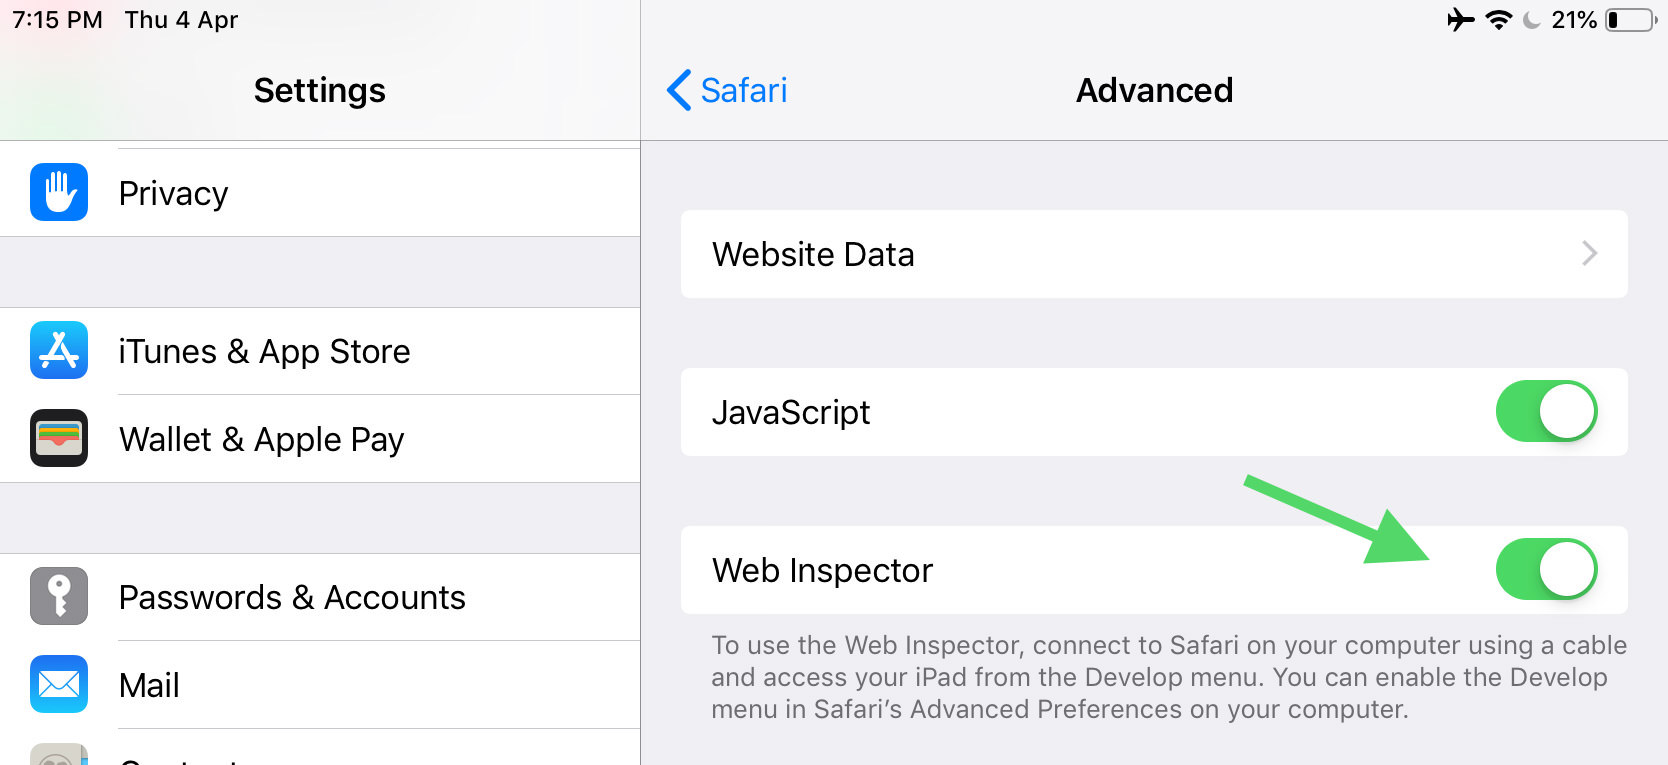
Then, in your iPad or iPhone, go to Settings > Safari. Similarly, in the Advanced menu, enable the Web Inspector, like so.

For WordPress-based website
A relative path is required so that the CSS, Images, and JavaScript links are correctly loaded in the iPad or iPhone. If you are developing WordPress-based websites, all the asset paths are absolute. To make them a relative path, install and activate this plugin: Relative URL.
Once activated, the path URLs will turn from:
http://localhost:8888/wordpress/
…into something like what you see below:
/wordpress/
Debugging the Website
First, you need to know your network IP address number. Go to System Preference > Network. There, you will find the IP address. Also, ensure that your Apple devices – Mac, iPad, iPhone – are connected in the same Network so you can access the website wirelessly on the iPad or iPhone.

In your iPad or iPhone, launch the Safari app and access localhost:8888 followed by your web project directory – for example localhost:8888/wordpress. If you setup your local server using MAMP, localhost:8888 should be your default local server address.
As you can see below, we are viewing our website, which in this case is WordPress-based, on an iPad.

Furthermore, to be able to debug the website with Developer Tools, you need to plug your iPad or iPhone to your Mac using the USB. Then, in Safari, go to the Develop menu and select your connected device.

We are done.
In the following screenshot, as we select the DOM tree from the Developer Tools, you can see that respective elements on the iPad or iPhone are highlighted. You can now technically debug your website in iPad or iPhone, like you do on your desktop.

The post How to Debug Websites on iPad appeared first on Hongkiat.