For years now, developers and publishers could view how well their snaps are performing in terms of usage and popularity through the Snap Store Web interface, using the metrics tab. This functionality allows people to examine the cause and effect of their work, like software updates, marketing campaigns, or other events. But it requires manual intervention.
A new capability, currently under development and available in the edge channel of Snapcraft, allows developers and publishers to check the usage metrics for their snaps from the command line. This means that actions can be scripted, and it is possible to establish trends based on collected data.
Snapping on the edge
You will need to refresh Snapcraft from the edge channel to be able to use this new functionality. Moreover, you have to login on the command line, using your Snap Store credentials. Without those, you will not be able to get any information. Once logged in, you can view data for any snap that you own or have been added to as a collaborator.
snapcraft login

Enter your Ubuntu One e-mail address and password.

If you do not have an Ubuntu One account, you can create one at https://snapcraft.io/account

Email:
Password:
Second-factor auth:

Login successful.
Explore the data, make decisions
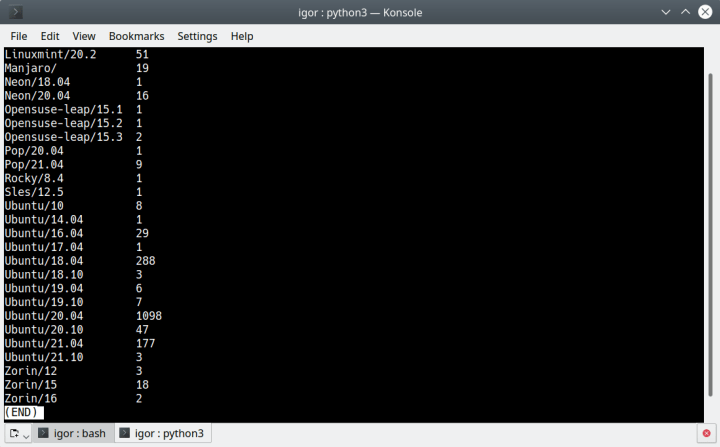
The usage is fairly simple, and yet, you have quite a bit of flexibility. The minimal required parameters include the name of the snap, the name of the metric you want polled, and the output format, which can be either in JSON or a simple table. You can also add the start and end dates – this can be rather useful if you have your own polling window, or if you want to examine the snap metrics against specific milestones. For instance:
snapcraft metrics snapppp --name installed_base_by_version --format table
Version  2021-08-18
19.08.3  552
21.08.0  8

The full syntax is available through the metrics documentation, including the list of currently supported metrics. You can list the data by country, application version, or operating system, all of which can give you insight into how your snap is behaving, and if you need to make any adjustments to your development or publication strategy.

In JSON format, the above output would look something like:
snapcraft metrics kompozer --name installed_base_by_operating_system --format json
{
  "buckets": [
    "2021-08-19"
  ],
  "metric_name": "installed_base_by_operating_system",
  "series": [
    {
        "name": "antergos/",
        "values": [
        1
         ]
    },
    {
        "name": "arch/",
        "values": [
           4
         ]
     },
...
Now, if you try to access a snap outside your control, you will see an error:
No permissions for snap.


Recommended resolution:
Ensure the snap name and credentials are correct.
Summary
Command-line metrics can be a powerful tool in the hands of developers. You can create a full hands-off workflow, including the collection of data, and any subsequent analysis. You can create triggers or alerts that will inform you of any actions you need to undertake. A sudden surge in usage may indicate a successful campaign, like having your snap featured in the Snap Store (can easily lead to x2-9 increase in active usage within a few weeks). Or it may correlate to an industry trend, like the growth of usage of VoIP and messaging tools due to changes in a geopolitical situation. Conversely, you may see a drop in usage, affected by an unpopular release, bugs or similar.
If you have any comments or suggestions on this topic, we’d like to hear from you. Since CLI metrics are still in the experimental phase, your feedback could help us improve the product, or implement additional capabilities. Please join our forum and let us know what you think.
Photo by Nick Hillier on Unsplash.

