In recent pieces here on the blog, we’ve gone deep on various considerations to bear in mind when creating a knowledge base – and we’ve also highlighted some excellent real world examples to learn from.
This time around, we want to hone in on an aspect of running your own knowledge base in the context of one of our solutions – analytics options in KnowAll.
In addition to knocking it out of the park in terms of user-facing features and overall look and feel, KnowAll also puts a number of highly useful analytics options at your fingertips, which helps you create even better content over time.
In this piece, we’ll step through the main options available within the theme. Firstly though, let’s get some basic info out of the way, before we dive into the specifics.
Getting Started With KnowAll
Getting up and running with KnowAll couldn’t be simpler. Your purchase entitles you to a 30-day money back guarantee and access to premium support, so you’re in safe hands from the get-go.
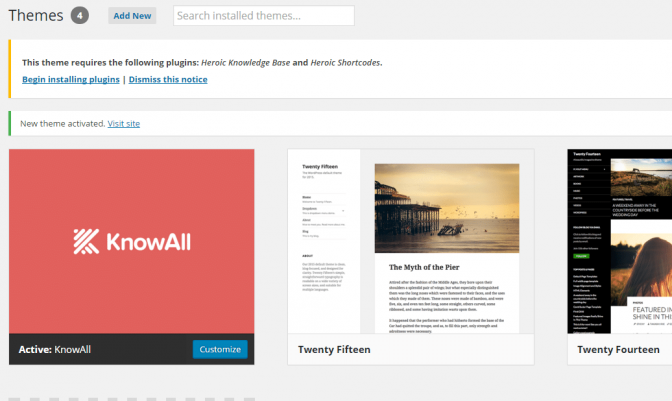
As the handy KnowAll knowledge base makes clear, installation is a snap. Simply install and activate it as you would with any other theme, and you’ll then be prompted to do the same with two additional plugins included in your purchase: Heroic Knowledge Base and Heroic Shortcodes:
Once those are both activated, we’re ready to rock. It’s the integration with Heroic Knowledge Base that actually opens the door to the advanced analytics we’re after, so let’s move on to look at what it makes possible.
A Quick Overview of the KnowAll Dashboard
A quick trip into Knowledge Base > Analytics gives us an instant feel for how knowledge base content is actually performing via the Dashboard tab. The first thing to notice is the handy date picker in the top right corner, which enables you to isolate specific time periods of interest. This is set to the last 30 days by default:
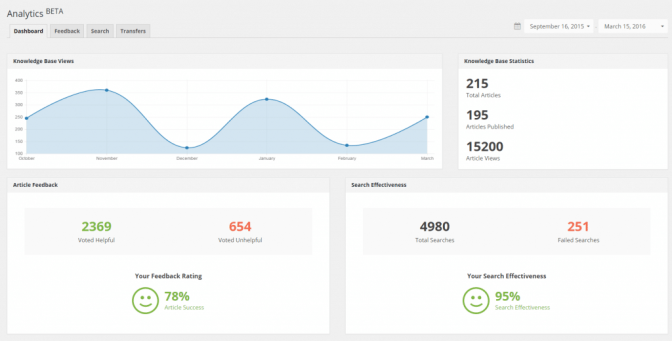
With a date range established, you’ve got four main areas of information to focus on:
- Knowledge Base Views: This is simply a graph plotted over time covering visits to your knowledge base’s articles, categories, and archives.
- Knowledge Base Statistics: For the time period in question, this gives you the total number of articles, views, and published articles at a glance.
- Article Feedback: This gives you a quick view of helpful and unhelpful vote totals, and your overall rating expressed as a percentage.
- Search Effectiveness: Here you can see the number of total searches, failed searches, and overall effectiveness as a percentage of the two.
The nice thing about this combination of data is that you can get a very quick feel for the overall depth of your content, how many people are actually interacting with it, and how it’s performing. With a quick look at the relevant data for any specific date range, you’ll instantly know whether you’re in good shape or not.
Exploring Feedback Options in KnowAll
Popping into the Feedback tab enables you to get a bit more granular on user reactions to your content. Again, you’ll notice that the date picker is there for you to select a specific time period:
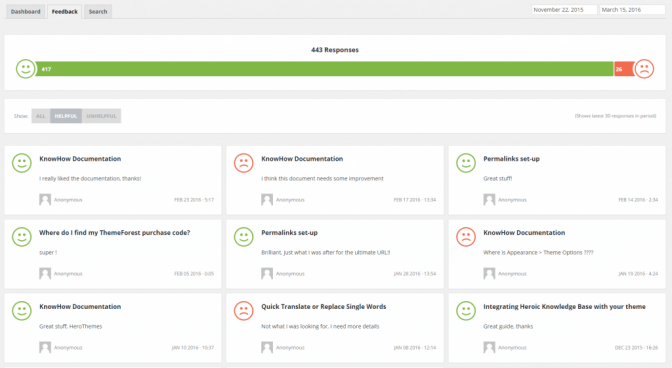
You’ll see overall numbers at the top of the screen, followed by three sub-tabs that enable you to see all pieces of individual feedback, or filter by positive and negative reactions.
Make it a regular practice to scour recent entries and schedule improvements to your content, and you’ll see the overall quality of your knowledge base soar over time.
Making the Most of Search in KnowAll
Search is a key component of any successful knowledge base, and KnowAll’s smart design encourages users to make the most of it. You’ve also got the option of digging into the search data behind the scenes by visiting the Search tab:
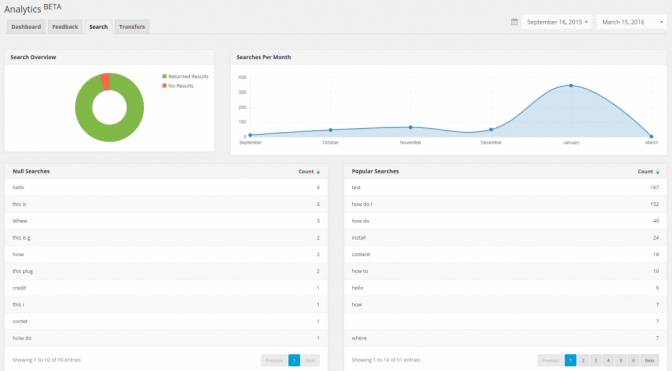
You’ve got four sections to dig through here:
- Search Overview. This pie chart gives you a quick read on how well search is performing, by distinguishing between successful and unsuccessful searches.
- Searches Per Month. This gives you a nice, clean view of search volume trends over time. Again, you can select your date ranges at the top of the page.
- Null Searches. This is a goldmine in terms of both user intent and content improvement. Sift through these results and you’ll quickly see areas where your users are screaming out for more information.
- Popular Searches. Again, this one shows user intent, and points the way towards areas of your site that you can potentially look to expand or build on.
As with the previous feedback option, regular review of the data made available to you here will help you substantially improve your content over time.
Taking Advantage of Transfers
Finally we come to the Transfers tab. This unique feature gives you a quick read on the points in your system where you’re leaking users:
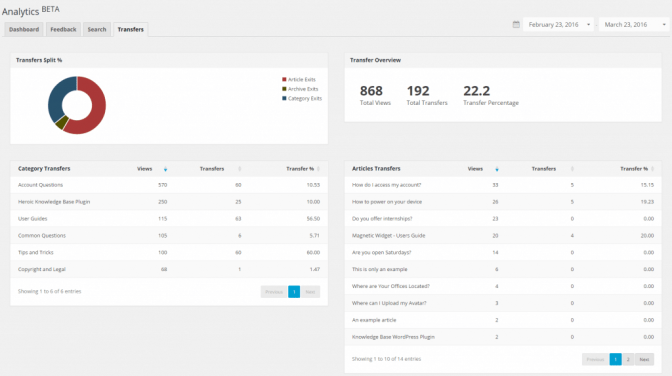
You’ll see an overall breakdown of how often people are leaving your site, and detailed info on which pages and categories are performing poorly. Again, a little digging here should be enough to pinpoint potential areas of improvement in your knowledge base.
Conclusion
Putting together a great knowledge base is all about committing to iterative improvements over time. By choosing KnowAll as your theming solution, you also get access to a tight set of genuinely useful analytics options – enabling you to continually make your content better in response to real world user feedback.
Let’s step through the four main screens and what they help you do one more time:
- Dashboard: Gives you an instant read on overall knowledge base performance.
- Feedback Options: Tells you exactly what users are thinking.
- Search: Shows you where content is potentially missing.
- Transfers: Helps you plug the gaps where people are leaving the site.
Got any questions about analytics in KnowAll, or tips to share with other readers? Get in touch via the comments section below and let us know!
The post Your Complete Guide to Analytics Options in KnowAll appeared first on HeroThemes.