At the end of 2020, WPMU DEV Hosting introduced a new data center location in Australia. In this article we put it to the test to see how much speed WPMU DEV members can now gain targeting an audience down under.
There’s a reason droves of WPMU DEV members demand we scour the globe looking for new locations (like Australia) to plant our hosting flag into and claim.
Server location matters.
After all, it’s no secret that if your visitors are closer to your site’s data center, then said site is naturally going to load faster for them.
The real question is:
“How much does server location matter?”
That’s what I’m investigating in this article.
I’ll be testing the performance of a site hosted in Australia and comparing to one hosted in Singapore – which before now, was the closest WPMU members could host to Australia.
Is it worth switching locations if you or your clients target (or wish to target) our Aussie friends? Read on to find out.
As a little bonus, I’ll also show you how to inject your sites with even more horsepower using our hosting’s Static Server Caching (Fast CGI) which increased speed 20 times over! See below.

Skip Ahead:
- The Introduction Of Our New Australia and Japan Data Centers
- How The Server Testing is Going To Work
- Testing Server TTFB With KeyCDN
- Testing TTFB and Load Time With Chrome DevTools
- Enable Static Server Cache For 20X More TTFB Speed
The Introduction Of Our New Australia and Japan Data Centers
Right before Christmas last year our brand new hosting locations in Australia (Sydney) and Japan (Tokyo) went live.
The addition of these two new locations (particularly Australia) was highly requested by our members, and after months of modifying the API of our hosting and selecting the perfect provider, we finally made it happen.
Speaking of providers, if you aren’t aware, we use DigitalOcean for all our other hosting servers. Sadly, DO does not have data centers in Australia or Japan, but we didn’t let that stop us…
Long story short, we teamed up with Linode, who have a similar setup to DO, with the added bonus of servers in the new locations. Score!
All of this means that if you (or your own clients) have potential customers in these regions, our hosting can now serve your sites to them in blazing-quick time.
But let’s test it to be sure.
How The Server Testing is Going To Work
To demonstrate the performance benefits of hosting closer to your audience, I used a couple of different performance testing tools.
- KeyCDN’s performance test – measures the TTFB of a site from a range of different locations around the world.
- Chrome DevTools – a handy tool built straight into your Chrome browser. I’ll also be using this to measure TTFB, as well as the load time of our test sites.
FYI, both of these tools are free, so follow along and run your own tests if you want.
Establishing a Level Playing Field
I started by creating two Bronze-level sites on WPMU DEV Hosting. Using the same site template for each – which members can quickly whip-up using our site cloning feature.
I also selected this simple freelancer template by Beaver Builder for both sites:

Next, was selecting a unique server location for each site – one in our new Australian location and the other in Singapore.
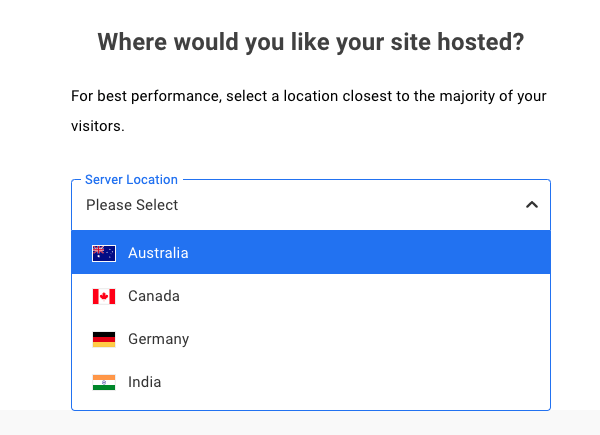
As mentioned, I chose Singapore, as before the end of last year, it was the closest location WPMU DEV members could select if they were targeting an Australian audience.
Making this a great way to compare and show the speed-benefits the new server gives you.
That was all I did with the sites for the time being. Both identical, completely out-of-the-box, no adjustments made.
Testing Server TTFB With KeyCDN
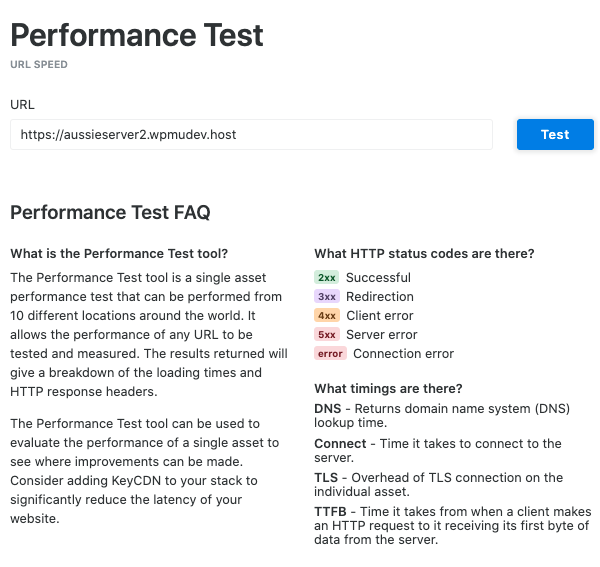
First up we have KeyCDN’s performance testing tool, which we also used in our recent WordPress hosting experiments, where WPMU DEV faced off against the best in the biz (and did pretty darn well!).
The tool tests a selected URL from 10 different locations around the world. The results then give you a breakdown of various load times and HTTP response headers.
In this case we’re using the tool to measure the TTFB of our two sites. In short, TTFB is the time taken from when a client makes a request to receiving the first byte of data.
*You can learn more about TTFB in our in-depth guide: How To Reduce Your TTFB and Boost WordPress Page Speed.
To get started, paste the URL of the site you want to test and in seconds you’ll have a breakdown of the various performance metrics.
It’s also worth noting that refreshing the test will give you different results.
As a rule of thumb, I refreshed the test a handful of times to see what kind of speed was possible. After a few tests you should notice a rough trend starts to appear. I applied this same logic to all the other tests performed in this article.
One more thing to keep in mind… something I found out the hard way…
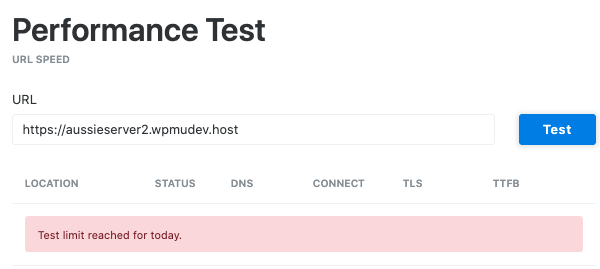
Beware Of The Daily Testing Limit!
Although the tool is free, there’s a limit to how many performance tests you can run per day.
The lesson here – don’t be like Rick!
KeyCDN Performance Test Results
Here are the results I got back after running both sites through the tool:
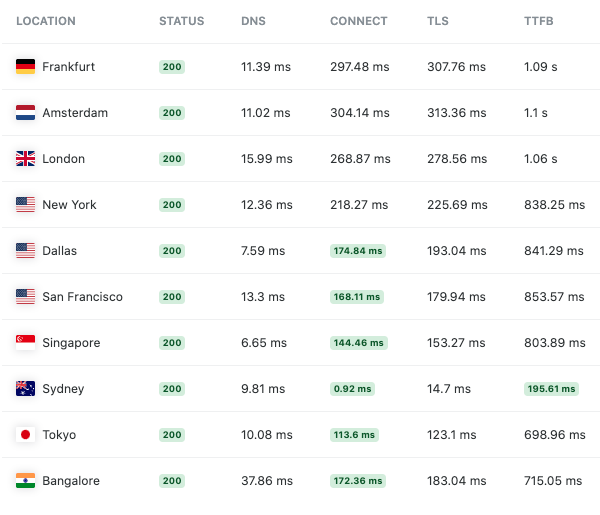
Test 1 – Australian server:
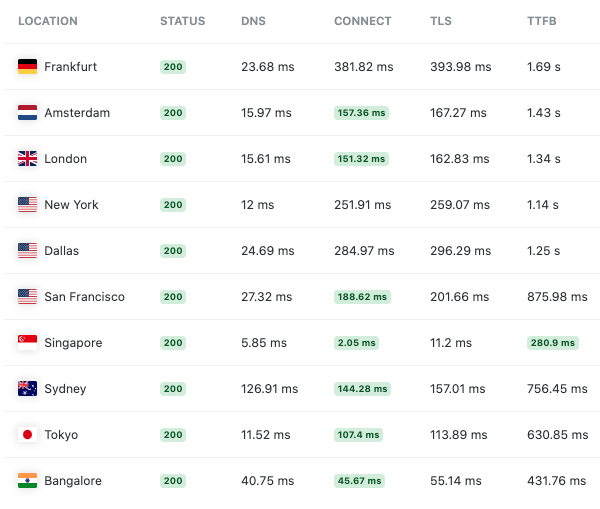
Test 2 – Singapore server:
Takeaways:
Both servers performed as expected. The Australian server had a TTFB of 195.61ms in the location of Sydney.
The Singapore server wasn’t too shabby either, posting a respectable TTFB of 280.9ms in Singapore.
However, the key metric to highlight here is the difference in speed between the Australian and Singapore servers from Sydney.
In this case, we’re comparing the Australian site’s time of 195.61ms, to Singapore’s 756.45ms.
Which tells us that with the release of our Australian server, your site could possibly now gain an extra 560.84ms of speed.
Plus, Singapore’s score of 756.45ms isn’t great as Google PageSpeed recommends reducing your TTFB speed to less than 600 ms (instant test fail!).
But it doesn’t stop there.
Testing TTFB and Load Time With Chrome DevTools
Another method of testing which was brought to my attention by one of our in-house developers (as he’s a lot smarter than I am), was using Chrome DevTools.
Like our previous performance test, anyone can do this for free, and even better… NO TEST LIMITS!
During this round of testing we’ll be once again measuring TTFB, along with site load time.
One key difference here is that in contrast to how KeyCDN tests from locations around the world, this test is instead relevant to where you are.
The results can also be impacted by factors like: the quality of your internet connection, internet speed, if you’re streaming an addictive Netflix series while testing. You get the idea.
As long as a comparison is done at the same time, under the same conditions, it should be fine.
Finally, for reference, I live in New Zealand, meaning the results should be better for our Australian-hosted site.
Let’s find out.
Not Familiar With Google DevTools?
Here’s a quick breakdown of how to run this test.
This was done on a Mac, using a Chrome Browser. If you use another browser, here are some alternative DevTools options.
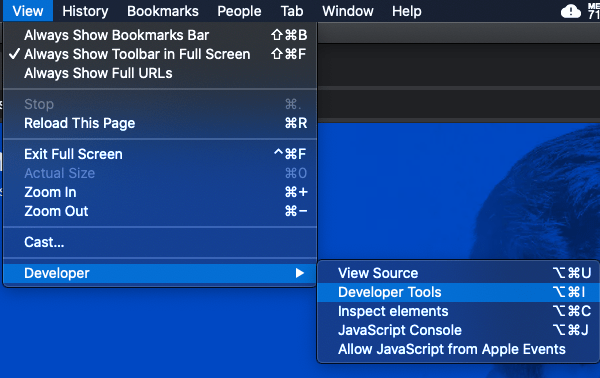
Start by navigating to Developer Tools via the toolbar or keyboard shortcut (depending on your device).
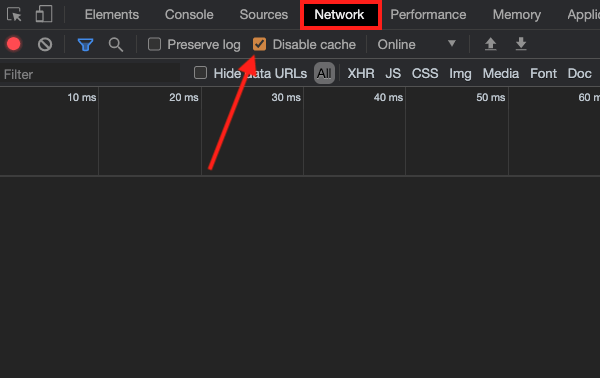
You’ll then need to find the Network tab, and select Disable cache to ensure you’re not using your local browser’s cache.
Next, refresh the page and you’ll see a list of all the server requests, as well as Load time, which is one of the metrics we’re focusing on here.
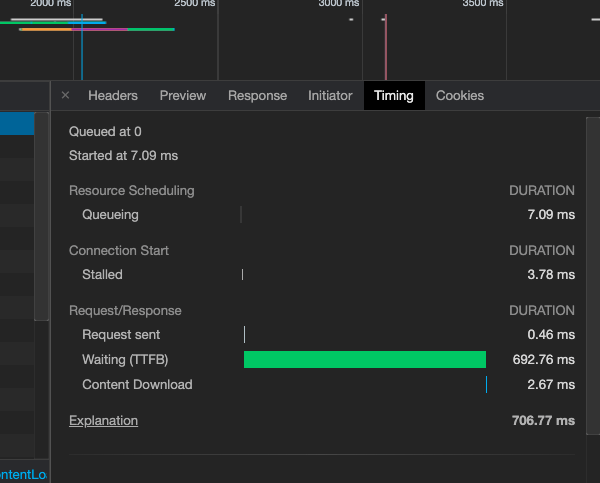
The other metric is of course TTFB. To view TTFB, click on the first item, which should be the URL of your site and the first request the server has responded to.
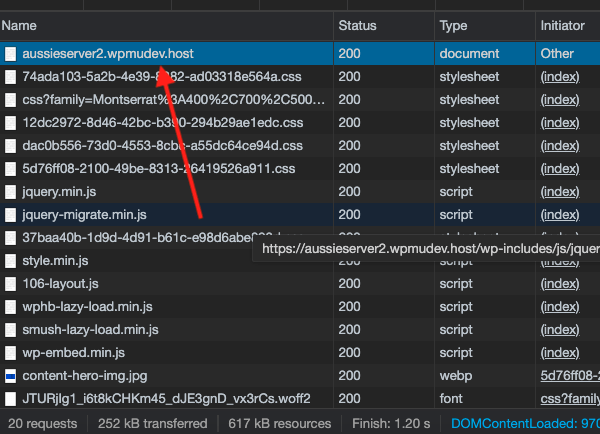
You’ll then see the TTFB data. Note that each request has its own TTFB and they all impact your overall speed.
It’s also why these results appear different to the TTFB results we got from KeyCDN earlier.
So in order to not drive ourselves insane, we’ll stick to recording the TTFB of our first request.
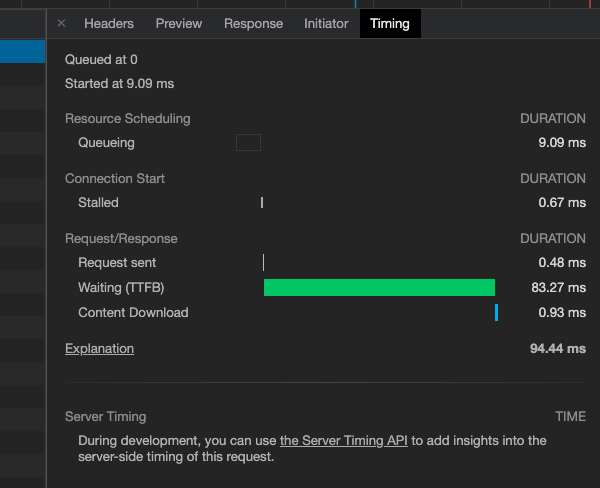
DevTools TTFB Test Results
Let’s have a look at the results of our tests:
Test 1 – Australian server:
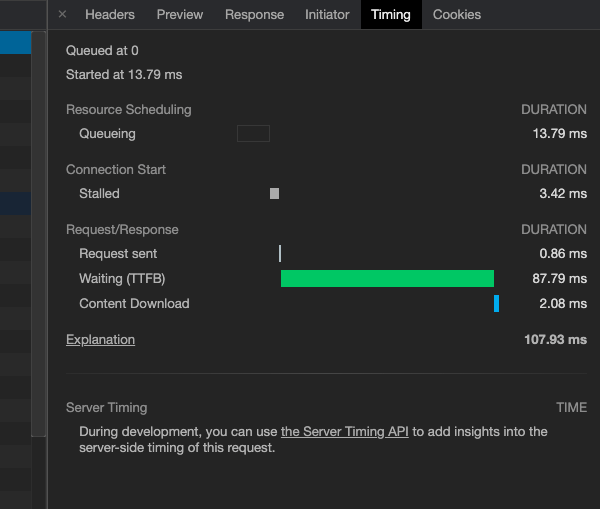
Test 2 – Singapore server:
Takeaways:
Like our KeyCDN results, from my location in NZ, The TTFB difference between the two sites was significant. Over 600ms in this case.
We also now have our new testing metric to look at: Page load time – which is the time taken for your site to load in its entirety (CSS, images, assets, scripts, fonts, etc.).
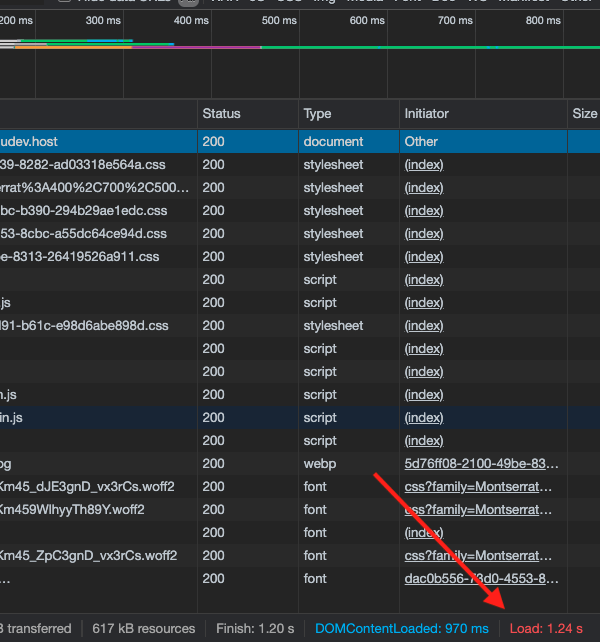
DevTools Load Test Results
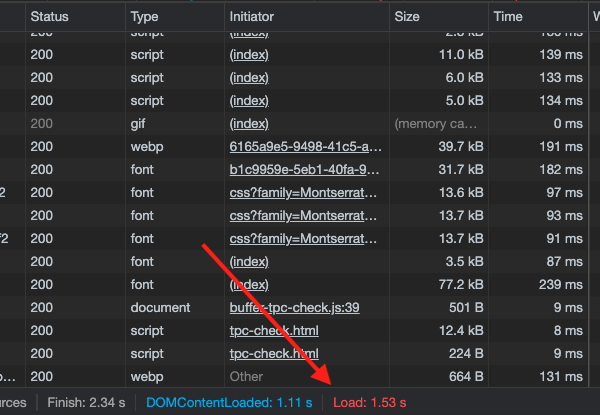
Test 1 – Australian server:
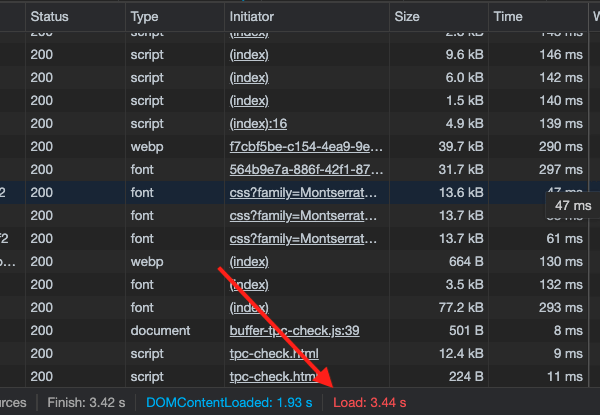
Test 2 – Singapore server:
Takeaways:
We saw quite a significant contrast, with Australia recording 1.53 seconds and Singapore lagging behind slightly with 3.44 seconds. A difference of 1.91 seconds.
Upon first look, it may not seem like much. But to put it into perspective – according to Google, the chance of someone bouncing from your site increases by 32% when a page load time goes from one to three seconds.
And most would agree, every second (or MS!) counts when it comes to page speed.
BONUS ROUND: Enable Static Server Cache For 20X More TTFB Speed
Now let’s take things up a notch. We’re going to show you how to add even more horsepower to your site, with the help our hosting’s Static Server Caching (Fast CGI).
SSC enables page caching at the server-side using FastCGI, greatly speeding up your site and allowing for an average of 10 times more concurrent visitors.
Think of it kind of like the 100m Sprint at the Olympics… only the competitors are allowed to enhance themselves as much as they want!
Let’s see the full potential of our site-sprinters.
Start By Activating Static Server Cache On WPMU DEV Hosting
This can be easily done from our site management platform, The Hub.
Select the site you wish to optimize and find the Hosting tab.
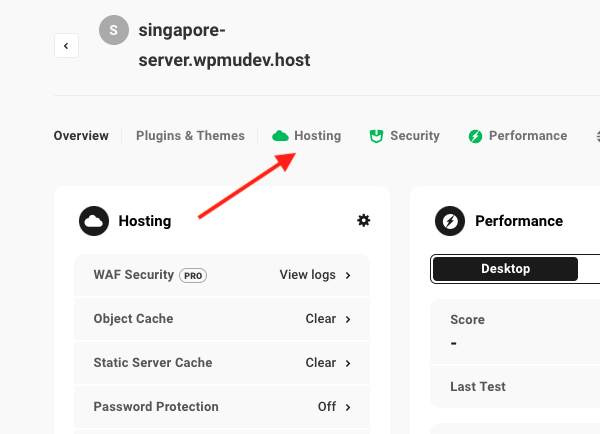
Next click on Tools and then scroll down until you find Static Server Cache.
It’s then as simple as activating SSC and choosing to clear it.
Static Server Cache TTFB Results
With SSC activated, I went back to our KeyCDN performance test and re-tested the Singapore site.
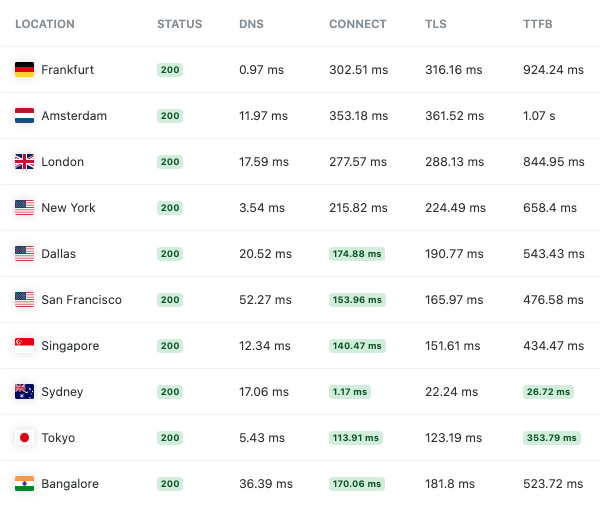
Test 1: Singapore Server No Static Cache
Test 2: Singapore Server Static Cache Enabled
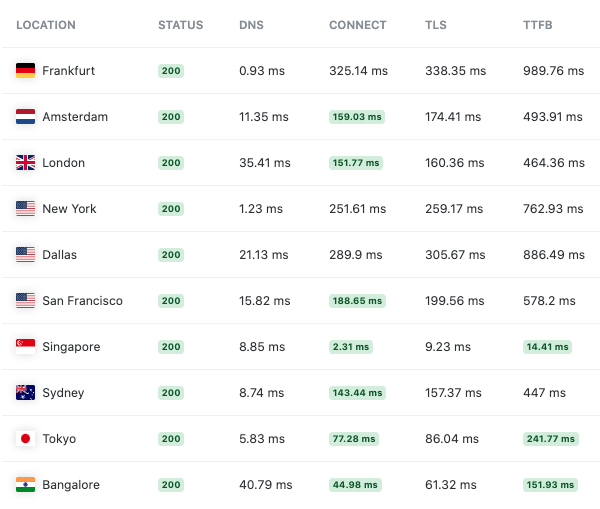
Takeaways:
Fast CGI lived up to its name in this instance. Activating and clearing Static Server Cache resulted in a 20X speed improvement! Dropping our original reading of 280.9ms down to a mere 14.41ms.
And Our Australian Site Was No Different…
Before:
After:
Okay, so it wasn’t quite 20X in this case, but I’m sure most people would be fairly pleased increasing their TTFB speed 7.5 times over.
It’s All About [Server] Location, Location, Location
That’s a wrap on this behind-the-scenes look at our server performance testing process.
To sum up, the release of our new Australian server location means WPMU DEV members targeting an audience down under can now enjoy a significant speed increase.
This was evidenced further by the results of our own tests where we managed:
- An extra 560.84ms of TTFB speed
- A site load time increase of 1.91 seconds
In an environment where a high page speed score is the Holy Grail, shaving off those extra seconds becomes crucial. Plus, fast loading sites are only going to improve UX and make your visitors less likely to bounce.
On that note, if you’re a WPMU DEV member and you want to migrate an existing site to a new hosting region, using the Cloning feature is the easiest way to do so. Get in touch with 24/7 support if you need any help with this.
Not Hosting With WPMU DEV? We’ll Help You Migrate For Free
We won’t judge, but consider this a great opportunity to finally make the jump! Especially if your target audience includes (or potentially includes!) Australia or Japan. You’ll also get instant access to the 20X Static Server Caching (Fast CGI) we mentioned above.
Better still, you won’t have to lift a finger – we’ll happily migrate your site(s) for no extra charge.
Check out our WPMU DEV Hosting page for full details and keep an eye out for more exciting developments coming in future.
Source: premium.wpmudev.org