Beehive Analytics is your all-in-one Google Analytics Dashboard, keeping you in the loop when it comes to your site traffic and making analytics less of a chore. Easily track your statistics straight from your WordPress dashboard and stay on top of your marketing game. Here’s everything you need to know…
Google Analytics can be daunting for inexperienced users. When all you need are a few simple statistics, having to navigate its interface whilst being faced with rows upon rows of numbers can be a bit overwhelming.
From your most-visited pages to your most-popular referral platforms, Beehive saves you this headache by making all of your most important stats available to you at a glance.
This article will talk you through how to get set up and make the most of Beehive.
Read on to find out more about:
1. Connection Options
2. Setting Up an API Project
3. Configuring Your Permissions
4. Beehive Dashboard Overview
5. Beehive Dashboard Widget
6. Checking Your Reports
7. Enabling Display Ads
8. Using Beehive with Multisite
1. Connection Options
First things first – to use Beehive, you need to have a Google Analytics account.
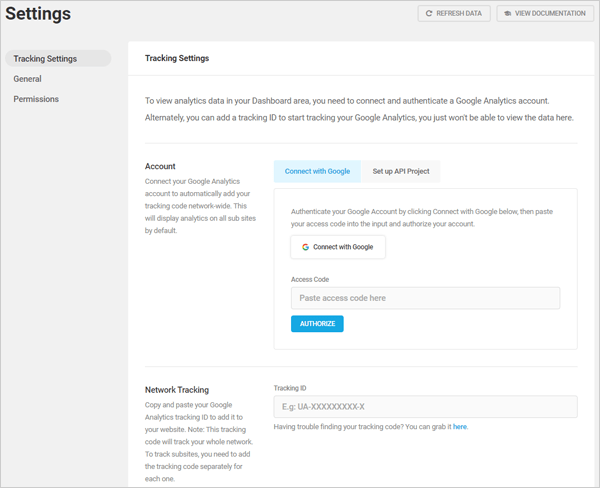
There are three different routes you can go down when connecting your analytics account to Beehive:
Tracking ID only – Adding just a Tracking ID allows data to be sent to a property within a Google Analytics account, but that data can only be viewed in Google Analytics and will not be available on the dashboards of the target site(s).
Connect with Google – This method utilizes a shared API to display tracking statistics on site or network dashboards but comes with limitations.
API Project (recommended) – Creating a custom API Project for a specific site or network allows data to be displayed on site and network dashboards without the limitations of a shared API.
2. Setting Up an API Project
Below we will take you through how to set up Beehive as an API Project. It is our recommended method as you won’t be sharing API credentials with anyone, plus you can personalize your authentication screen icon and project name.
Head to the Google Developer Console and select a new project.
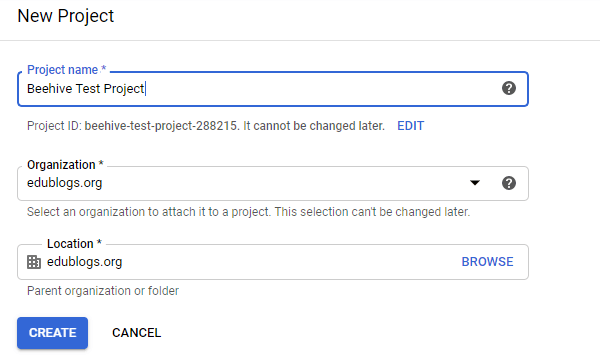
Select your organization and location and click Create.
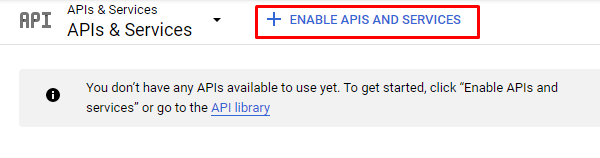
You will then be met with a message informing you that you have no APIs available to use. Click on Enable APIs and Services just above this message.
On the next screen, you will see tons of different API categories, however the only ones you need to enable are Google People, Google Analytics and Google Analytics Reporting.

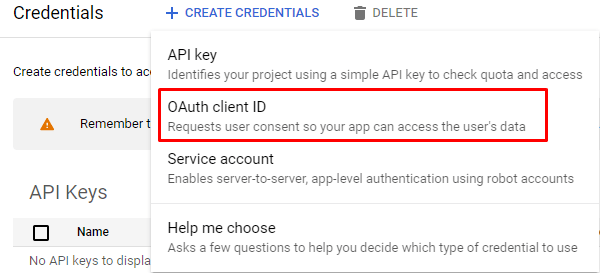
As Google requires informed consent for most of its data collection APIs, in order to run Beehive, Google needs a OAuth 2.0 Client ID which requires that users grant consent to the data collection via a consent screen.
You can set this up by heading back to the Google API dashboard and clicking Credentials.
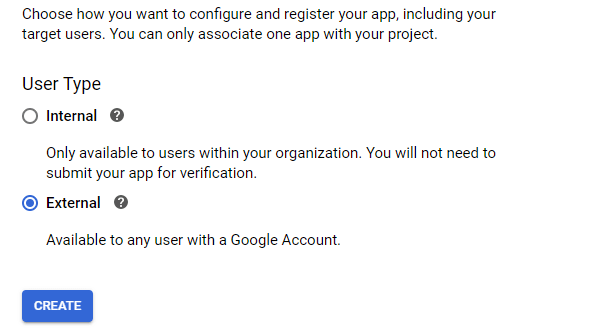
On the next screen, you will need to choose the type of users that will be using Beehive. This will generally be external if you want to give access to people outside of your organization such as clients or agencies.
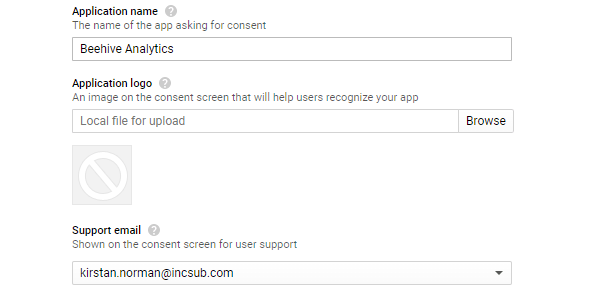
The next screen may look a little daunting, but all you need to do is fill in a few pieces of simple information.
First of all, add the application name (e.g. Beehive Analytics), and add a logo if you wish. Please note that adding a logo may mean that Google has to verify the plugin, which may prevent you continuing with the setup until the verification is complete.
Scroll down to Authorized domains, add in your site address, then click Save.
You will then need to head back to credentials and again click Create OAuth client ID.
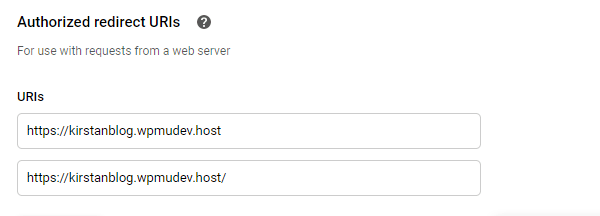
Select the application type as Web Application, name the client and add the Authorized Redirect URIs.
You must add the Redirect URI twice – once ending in a forward slash, and once without.
Click Create and a pop-up will appear containing your Client ID and Client Secret.
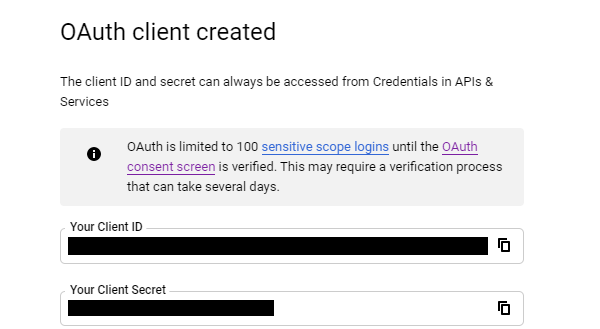
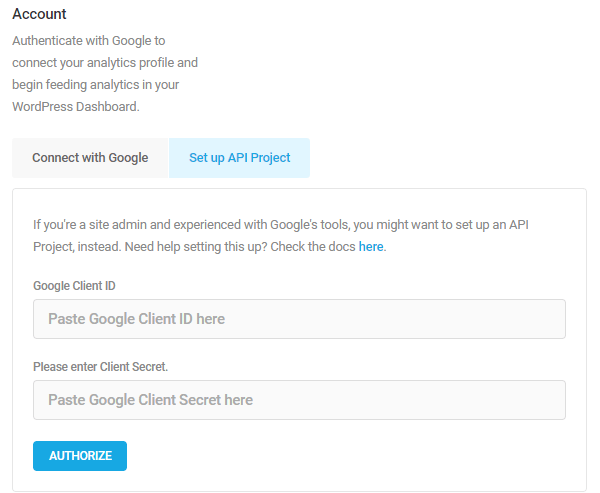
Head back to Beehive and click on the settings page.
Click the Set Up API Project option and copy across the two pieces of data from your Google API.
You will then be prompted to link your Google account. Follow the quick steps and your account should be successfully linked.
Last but not least, you will need to choose a profile, as you can have more than one site connected to your Google Analytics account.
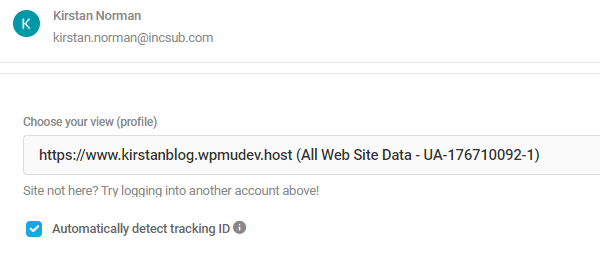
If the site you are connecting is the same site as the one you have installed the plugin on and are currently using, you can tick the Automatically detect tracking ID box.
If you are tracking the analytics for a different site, you will need to add the tracking ID manually. There is a link further down the page which takes you to Google’s instructions on where to find it.
The hard part is now over and you can now start exploring Beehive!
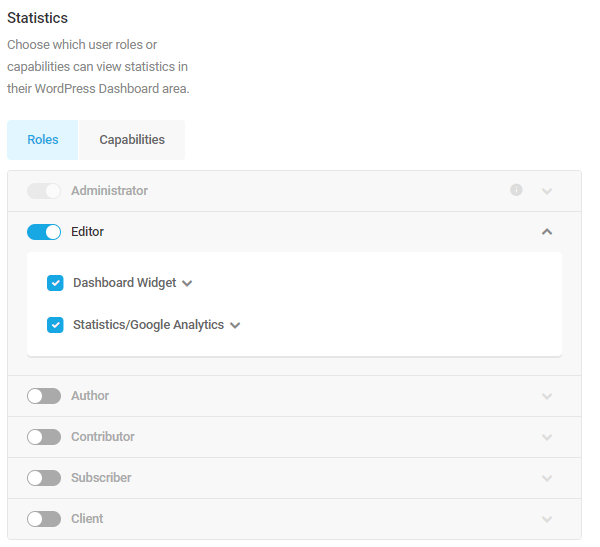
3. Configure Your Permissions
As standard, all administrators have access to Beehive. You can grant permissions to view the widget and analytics stats to other users either by role or by capability.
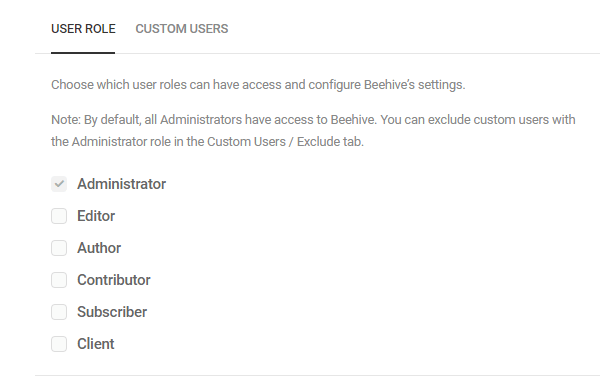
You can also choose who gets access to Branda’s settings, which allows the user to change the linked accounts.
4. Beehive Dashboard Overview
For a less-experienced user, Beehive’s dashboard is a breath of fresh air compared to Google Analytics.
Your main stats are displayed on one simple and easy to understand screen, and you can quickly flick through past results by using the drop-down in the top-right corner.
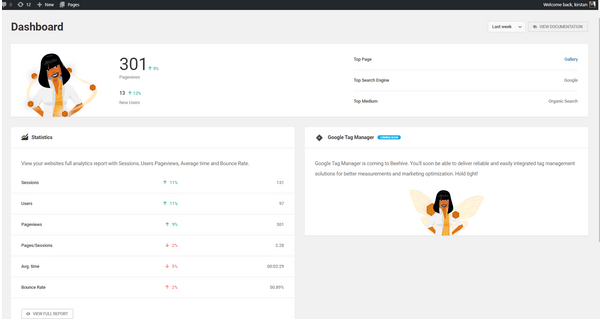
The dashboard displays a running total of page views for the current week, as well as the number of users, sessions, average time, and bounce rate.
Beehive’s dashboard features a handy comparison so that you know how your stats are holding up compared to last period.
5. Beehive Dashboard Widget
This easy-to-digest theme runs through to your main dashboard, where Beehive automatically adds a detailed summary of your Google Analytics stats.
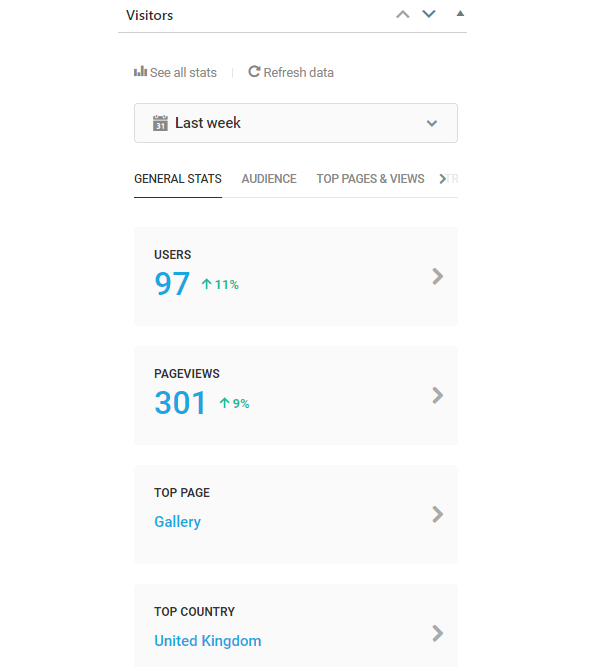
You can see a quick overview such as your top page, top country, top referral, and page views. Flick across the menu to see a mini audience graph as well as your top pages and average time spent, and a roundup of your traffic activity.
It’s a simple way to keep an eye on your stats without needing to open up the plugin and getting into ‘analytics mode’.
Note: If you find yourself wondering why the WPMU DEV analytics widget in the WPMU DEV dashboard shows different data when compared to data displayed by other Analytics widgets, that’s because we use different metrics. We anonymize IPs and don’t track or store any personally identifiable information (PII).
6. Checking Your Reports
From the bottom left of Beehive’s dashboard, click ‘View Full Report’ to be taken to the good stuff.
You can switch the main graph to display the number of sessions, users, pageviews, average session time, and bounce rates.
Easily keep track of trends with Beehive’s handy graphs.
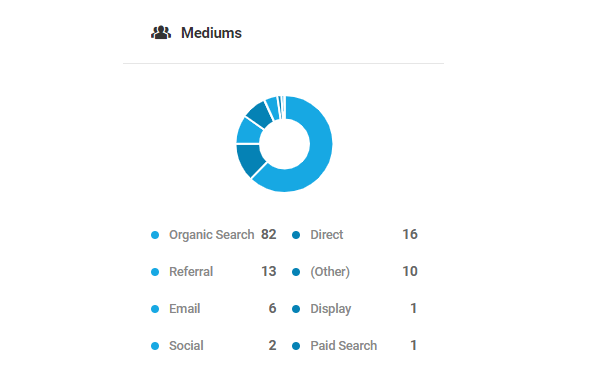
Next up are three simple donut charts which present some of your most important statistics.
First of all is the overall mediums chart. This outlines where your traffic is coming from and groups it into categories such as organic search, direct traffic, and social media.
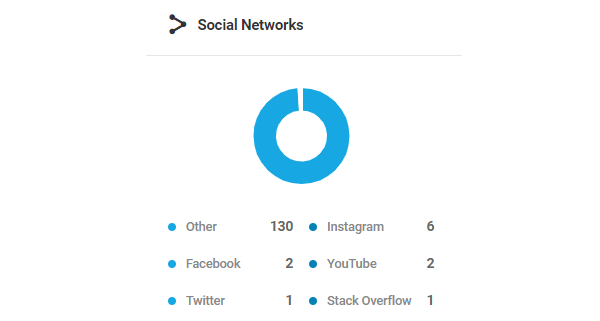
This second splits down the referrals from social networks, including all of the large and obvious ones, right down to Stack Overflow, Reddit, and even WordPress.
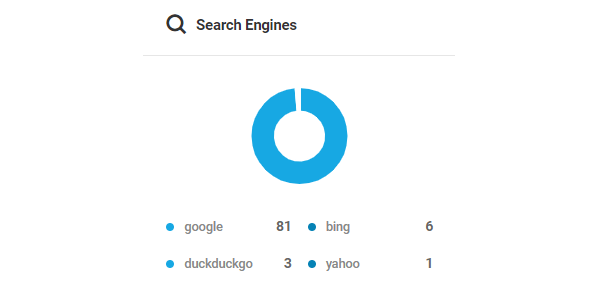
The last donut chart splits down the search engine traffic.
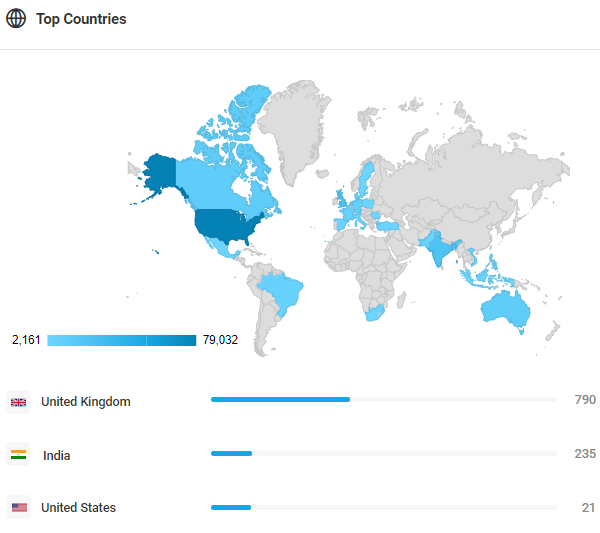
At the bottom of the page are the top countries and pages.
An interactive map displays the top places that your visitors hail from. You can move your cursor over a country to see an exact session count.
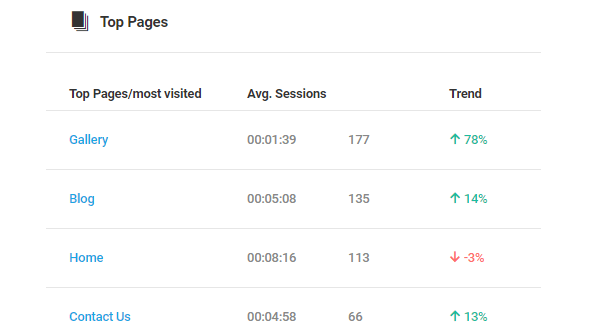
Last but not least are your top pages, along with the average session time, number of visitors and an indication of the trend.
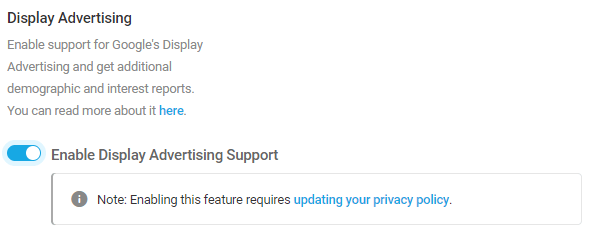
7. Enable Display Ads
Take your analytics a step further by adding Google advertising cookies to your site so you can do things such as:
- Create Remarketing Audiences based on specific behavior, demographic, and interest data, and share those lists with Google Ads
- Use demographic and interest data in your Analytics reports
- Create Segments based on demographic and interest data.
All you need to do to enable this is head to Beehive’s settings and click the toggle.
8. Using Beehive with Multisite Installations
Beehive wouldn’t be a WPMU DEV plugin if it didn’t work seamlessly with multisite networks.
There are a few different ways you can go about managing your network’s analytics. You can:
- Create a network-wide Google Analytics profile to track the entire network’s visits.
- Set up separate accounts to track each subsite individually.
- Connect your network URL with Google Analytics and all subsites will automatically show their stats.
If you choose to allow your site admins to use Beehive, you can decide whether or not they can override your permissions. All you need to do is head to Settings>Permissions and tick the box.

Make Better-Informed Decisions
Once you’ve got your analytics account successfully linked to Beehive, tracking your stats becomes one of the simplest parts of running your website.
Everything you need can be accessed quickly and easily whilst going about your other site admin duties. With your stats so readily available, it can help you keep track of traffic trends and be on the ball if there are any issues.
If you like what you see, check out Beehive’s documentation for a more in-depth step-by-step guide to getting set up and check out our roadmap (keep an eye out for our Google Tag Manager update – coming soon!) to see what we’re working on.
Source: premium.wpmudev.org