GTmetrix is now powered by Lighthouse, delivering page performance test results that better reflect the user’s perception of how fast their websites are loading.
Any business that wants to stay in business knows it’s essential to have a fast loading website. Websites that load quickly retain more visitors and perform better in search engines Google.
We have written a number of articles on how to speed up WordPress and fix WordPress page speed problems using free page speed testing tools.
One of these tools is GTmetrix.
The new GTmetrix report is designed to help you assess the page’s user experience and looks at both structure and performance, i.e. how well the page actually performs for users in areas like loading, interactivity, and visual stability.
The main difference in the newly redesigned report is that GTmetrix has replaced its PageSpeed/YSlow libraries with Lighthouse, the open-source tool from Google that is considered the industry standard in modern web performance data and metrics.
In this post, we’ll look at:
-
- Using the New GTmetrix Tool
- Using Core Web Vitals to Improve Your Search Engine Results
- GTmetrix, Hummingbird, and Smush
- Will You Score the Perfect 100?
Using the New GTmetrix Tool
GTmetrix is free to use for generating a basic yet very useful site loading speed report.
Just head over to GTmetrix.com and enter your site or page URL, then click the test button.

A report will be automatically generated after a few seconds.
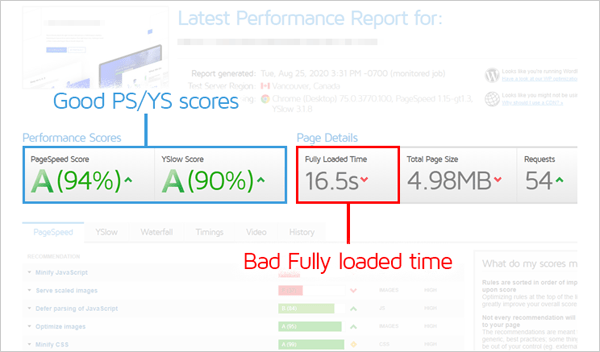
Previously, GTmetrix reports focused on how well your page was built for speed (i.e. its structure), but not how fast it loaded from your users’ perspective. This resulted in sites sometimes achieving great PageSpeed/YSlow scores and a slow Fully Loaded Time.
Fully Loaded Time (i.e. how long it takes for a page to completely load) has also become less useful as a metric for site performance as modern websites began to adopt more efficient page-loading strategies (e.g. client-side rendering).
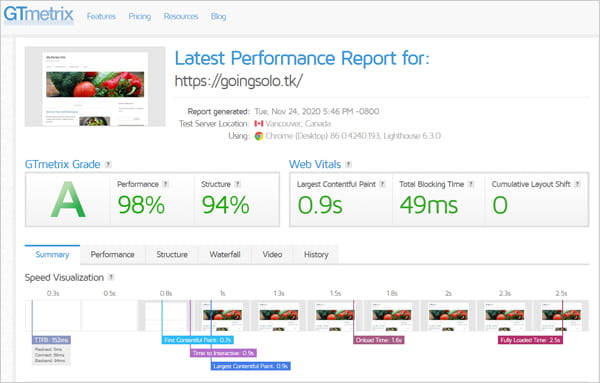
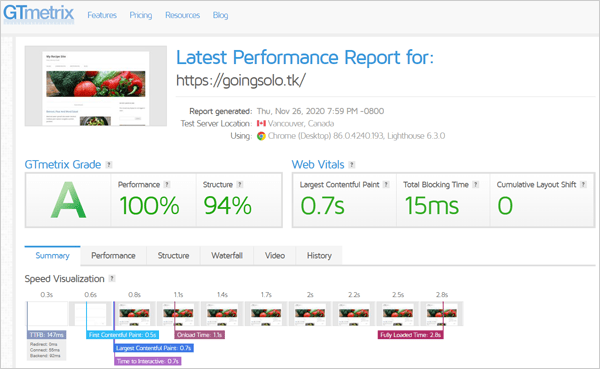
The new GTmetrix Report reflects how fast your page loads for users and how well it’s built for performance, using a new scoring system called the GTmetrix Grade.
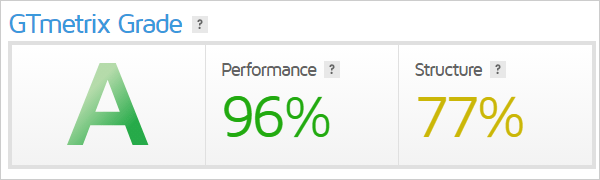
This is based on a weighted grade comprised of new Performance and Structure Scores (70% Performance Score + 30% Structure Score) and the addition of new tabs, visualizations, graphs, and deeper insights.
As mentioned earlier, what makes the new GTmetrix tool significantly different from its old Legacy report is that it has replaced PageSpeed/YSlow with (Google-owned) Lighthouse analysis and performance data.
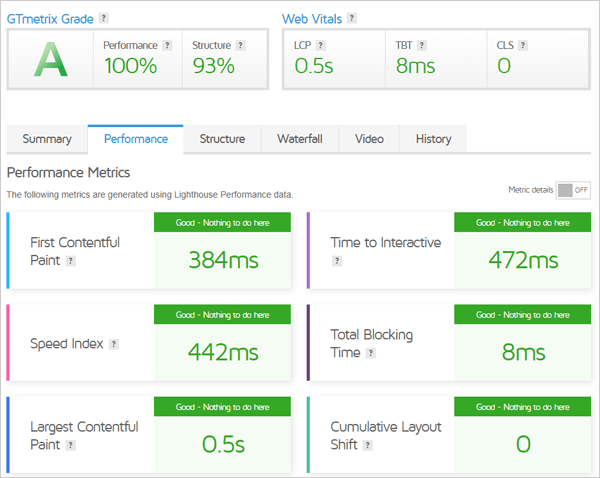
This provides an assessment of webpages focused on the pages’ user experience and tracks the timing of various milestones that users actually experience and care about, then scores each of these metrics in three key areas:
- Loading Performance (55% of the total score). This comprises of the following metrics:
- First Contentful Paint (15%) – measures how much time has elapsed before the browser begins to display the first elements of your site.
- Speed Index (15%) – shows you how quickly the contents of your page are being visibly populated.
- Largest Contentful Paint (25%) – measures how long the largest content element on your page (e.g. a featured image or heading text) takes to load on the users’ viewport.
- Interactivity (40% of the total score).
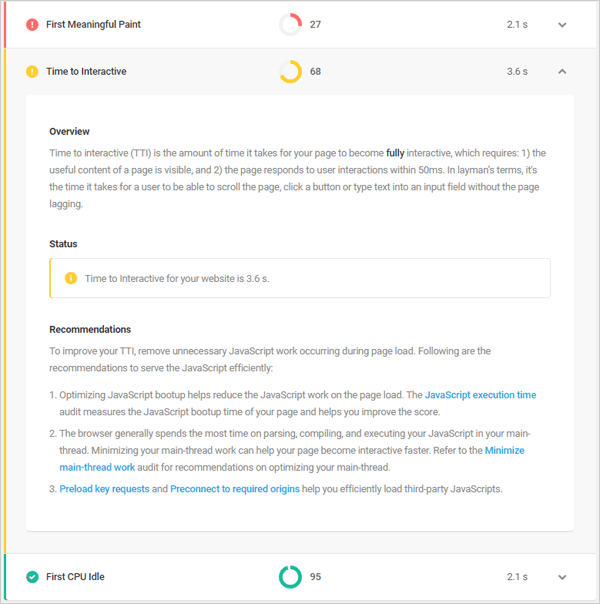
- Time to Interactive (15%) – measures how long it takes before the user can reliably interact with the content on the page (e.g. click links, enter text into input fields, etc.)
- Total Blocking Time (25%) – measures the total amount of time that a page is blocked by scripts from responding to user input (e.g. mouse clicks, screen taps, or keyboard presses) during your page loading process.
- Visual Stability (5% of the total score).
- Cumulative Layout Shift (5%) – Measures how much of your site’s content layout shifts as it loads (e.g. late-loading ads that negatively affect the user’s experience by pushing content down after it has already loaded).
Using Core Web Vitals to Improve Your Search Engine Results
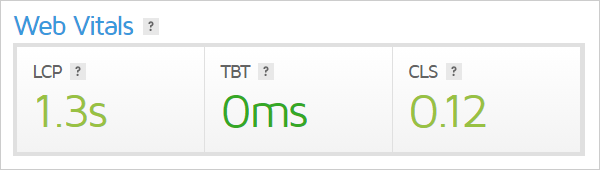
GTmetrix also displays another set of metrics in its reports called Web Vitals.
Most site visitors aren’t as concerned about how long it takes for your entire site to load as they are about how soon they can start engaging with the content on the page you’re presenting them.
As described on the feature’s information tooltip,
Web Vitals represent a small set of core metrics that indicate whether you’re delivering a fast and (what Google calls) a delightful experience to your visitors. Focus on these impactful metrics first before undertaking deeper optimizations.
Core Web Vitals comprise of three different metrics (see the previous section for brief descriptions):
- Largest Contentful Paint (LCP) – GTmetrix recommends aiming for an LCP of 1.2 seconds or less for a good user experience,
- Total Blocking Time (TBT) – GTmetrix recommends aiming for a TBT of 150 milliseconds or less.
- Cumulative Layout Shift (CLS) – GTmetrix recommends aiming for a CLS score of 0.1 or less.
Core Web Vitals, then, are an important indicator of how your site visitors perceive the performance of your website. These key metrics connect your site’s performance to user experience and Google thinks they’re important enough to include as an SEO ranking factor starting from May 2021.
According to Google, Core Web Vitals will affect mobile and desktop results and play a significant role in determining whether or not your content appears in Top Stories.
GTmetrix, Hummingbird, and Smush
If you use our Hummingbird and Smush plugins to optimize WordPress speed and images, you should find the new GTmetrix reports’ Lighthouse data and metrics to be more actionable after running our plugin scans.
This is because our plugins and GTmetrix now both follow Google’s PageSpeed Insights recommendations, which are derived from Lighthouse data.
Hummingbird’s scans and Smush’s settings mirror Google’s PageSpeed testing and automate many of its fixes and recommendations, while GTmetrix uses the latest API from Google Pagespeed Insights to create and compile its report.
For more information on improving Google PageSpeed Insights recommendations, see our Performance Optimization Guide and these tutorials:
- How to Optimize WordPress for Speed with Hummingbird
- How to Get the Most Out of Smush Image Optimization
Will You Score The Perfect 100?
I don’t want to spoil the ending here for you, but you’ll probably never get that perfect 100!
We’ve tried and discovered that there are many challenges when it comes to getting a perfect score on page speed test results.
Here are some articles we’ve written about the challenges of optimizing WordPress sites for speed based on the recommendations of tools like GTmetrix, Google PageSpeed Insights, and others:
- Why Trying to Get 95+ on Google PageSpeed Insights for Your WordPress Site Will Drive You Mad!
- The New Google PageSpeed Insights: A Perfect 100 Is Now Super Easy
- Why You’ll Never Get a 100 Google Pagespeed Insights Score
Also, definitely check out our video series on improving WordPress performance:
Scan your sites today and happy WordPress optimizing!
Source: premium.wpmudev.org