Take a behind the scenes look at how we performance-tested our hosting against some of the biggest WordPress hosts on the web.
What started as a simple in-house exercise to see how our hosting measured up, quickly turned into a fascinating journey of self-discovery.
A journey we’ve decided to share with you, dear blog readers.
After all, we pride ourselves on honesty and integrity round these parts. And once we decided we’d bring you along for the ride – one of the main goals (apart from kicking a**!) was to be completely open and transparent. Both with the results published, and our testing methods.
That way you can trust everything is legit and nothing has been swayed in our favor (which benefits no one BTW).
So that’s what you’re getting in this article.
An inside look into how one of our in-house experts tested WPMU DEV hosting against some of the most popular platforms in the biz.
Follow along and feel free to recreate our methodology for yourself.
*BTW, all of the tools mentioned in this article are completely free!
Here’s how it all went down…

The first step was to obviously create accounts with the hosting providers we wanted to pit WPMU DEV against.
Speaking of, here are the brave hosting providers DEV battled in this comparison (you’ll recognize ALL of them, no host dodging here):
- GoDaddy
- WPEngine
- Flywheel
- Cloudways
- Hostgator
- SiteGround
- Kinsta
- Bluehost
To make the testing as fair as possible, we compared the base level plans of each hosting provider.
We also used the same basic test website and added it to each hosting plan.
Here’s a peek at the test site we used (dog lovers prepare to “awwww”):
We tested every host with this simple (and darn cute!) pet website.
Time to get [host] testing!
Now for the fun part.
Once we’d established the basic (and fair) comparison points, it was time to start the testing process.
We wanted to see how each hosting server performed under pressure. After all, the last thing you want is your server to fail if you have a sudden influx of visitors.
We also wanted to test the speed of each host, as it’s important to serve your clients in a timely manner or they might get frustrated and click away.
So we ran two primary performance tests on each host:
- A hosting load test.
- A speed (TTFB) test.
Here’s how both tests unfolded, starting with the hosting load test:
Testing how many parallel users each hosting server could handle.
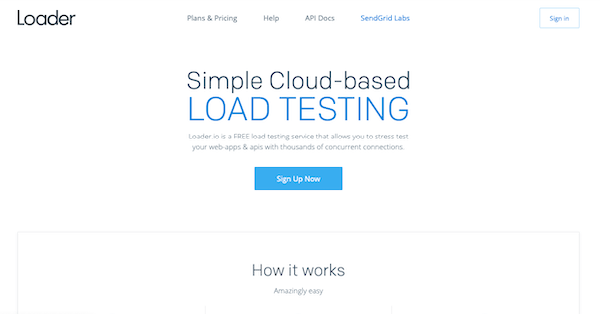
For this load test we used “https://loader.io/” a free load testing service that allows you to stress test your web-apps and APIs with thousands of concurrent connections.
Loader.io allows you to run three different kinds of tests:
1.”Clients per test” – You specify the total number of clients to connect over the duration of the test.

2.”Clients per second” – Similar to “Clients per test”, but instead of specifying the total, you specify the number of clients to start each second.

3.”Maintain client load” – This test allows you to specify a from and a to value for clients.

Since we were aiming to test how each hosting server coped under user pressure – we chose to run the “Maintain client load” test.
As mentioned, this test works by allowing you to specify a from and a to value.
What this means is that if you specify “0” and “2000” for example, the test will start with 0 clients and increase up to 2,000 simultaneous clients by the end.
Setting the client load test boundaries.
When running each load test, we set a max limit of 5000 clients. We found this to be an appropriate limit – as most hosts didn’t end up reaching 1000 clients anyway.
All of the tests ran for 5 minutes and the error failure was set to 1% as soon as errors started to appear. These errors include timeouts, 400/500, and network errors (all accumulating to 1%).
We chose 1% as the lowest possible value so the test would stop immediately and give the most accurate reading of max parallel clients.
This is important because if we had the fail setting at 50% for example, parallel client numbers would be a lot higher, but only because more users are being allowed (due to the higher error setting).
When in reality they shouldn’t count, as they would’ve got an error response – meaning they were essentially lost visitors.
The measurements we took into account.
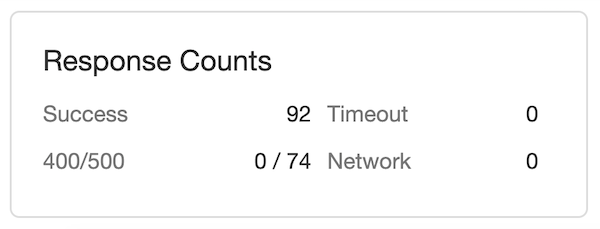
With this particular test, we were most concerned with the “Response Count,” and “Parallel Client” metrics.
Response Count shows you the overall success/failed responses:
Parallel Clients measures the amount of users the server can handle at one time before maxing out:
Why is the number of parallel clients a server can handle important?
Before we continue let’s break down this idea of “parallel clients” a little further…
In simple terms, max parallel clients is the number of people who can send the first HTTP request to your site at exactly the same time.
For example, let’s say your max number of parallel clients was 50. This means 50 people can access the site at the exact same time before the server crashes.
So if 60 people try to access at the same time, the server will restart and show an internal server error for the next few minutes while it gets back up and running – meaning you will lose visitors
Here’s a good analogy we like to use:
“If you prefer to have a bar serving beer to 10 clients and then closing it down because the 11th started a fire, fine by us.”
“We’d prefer a bar that serves 140 people in a timely manner. Even if it is a tad slower.”
Basically, it’s worth having a host with a higher parallel client number (even if the response time is a little slower) because having less parallel client capability puts you at more risk of your server failing and losing visitors.
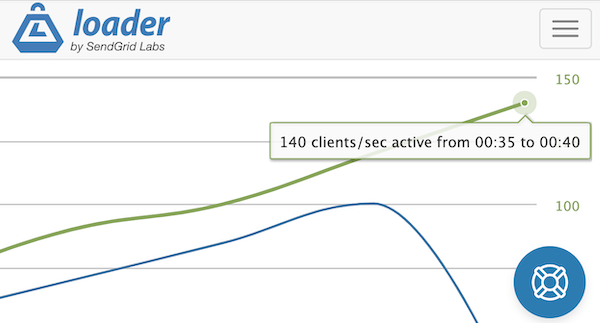
Watch a simulation of one of the load tests.
Another cool thing about Loader.io is it lets you watch a simulation of each test and how it all went down.
Watch an example of how WPMU DEV’s load test turned out here.
As well as running the test, Loader.io also allows you to watch a simulation of how the test unfolds.
Next, we put the speed of each host to the test.
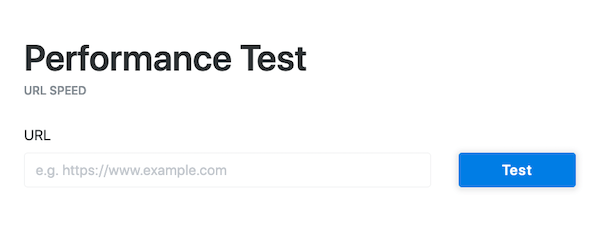
To test speed we used KeyCDN’s performance testing tool.
In a nutshell, the tool tests and measures the performance of any URL from 10 different locations from around the world.
There isn’t a lot to the test itself, simply paste in the URL you want to test and hit the button. Remember it’s also free, so you can use it for your own testing.
The results you get back then give a breakdown of the loading times and HTTP response headers. As below:
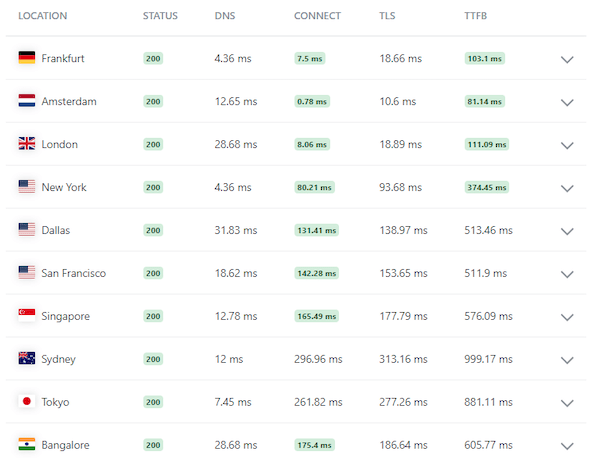
Looking at the table above, the metric we were most interested in for this test was “TTFB.”
TTFB measures the time from a client making an HTTP request, to then receiving the first byte of data from the server.
The big problem with comparing TTFB results…
The only problem is, TTFB (or the speed of a host in general) isn’t so straightforward to compare. This is because the speed will vary depending on the location of the hosts server in relation to the user.
For example, if the server you chose for your hosted site was located in The Netherlands, the TTFB reading from Amsterdam is always going to be better.
So in order to be fair to all the hosts involved, we chose to present the TTFB readings in two different ways:
- ”Average TTFB” (Geo optimized) – This was the lowest (A.K.A best) TTFB reading out of all the locations tested.
- ”Average TTFB” (Across all locations) – The average TTFB time across all the tested locations.
Levelling the playing field even further.
Another important aspect about our testing is the fact all tests were run WITHOUT taking caching into consideration.
Basically this means we tested the hosting servers themselves, not factoring in any caching or CDN implementations each host may have. This was done by forcing WP to be logged-in so everything is by-passed.
Why we think it’s better to test without caching (or a CDN) enabled.

In our opinion, comparing full page cache performance is not a good idea in a situation like this.
We believe this to be true for a couple of reasons:
- Bypassing cache allows you to test the performance of the hosting servers themselves. This is important as it means you don’t have to rely on caching mechanisms (more on why this is important below).
- Testing with cache doesn’t take “dynamic” website actions into account.
Any hosting platform can put a CDN in front of their site, tell it to cache everything, and then claim to give you insanely fast and scalable sites.
The problem is, this is not usually practical in the real world as WordPress, and many of its plugins are meant to be dynamic.
For example, caching is a great way to speed up simple sites or pages. Like an “About Page” – which seldom changes and for the most part wouldn’t have much live or dynamic action happening.
Compare this with a full-blown eCommerce store that’s constantly performing dynamic actions (live checkout process etc.) which bypass cache and hit your server directly.
That’s why you’ll often hear of (or experience) eCommerce stores having issues during big sales or promotions. Their servers aren’t prepared (or haven’t been stress tested!) and can’t handle all the simultaneous dynamic action happening.
Basically, your friend Mr. Cache isn’t always going to be there to save you, so it’s better to view it as an added benefit, and to still ensure your server is going to be able to cope on its own.
…So how did WPMU DEV fare against some of most popular WordPress hosts on the web?
Tune in to part 2 of this article to find out!
Yep sorry, we chose to be like all your fav Netflix shows and leave you with a good ol’ cliffhanger (it’s a brilliant little trick really).
Later in the week we’ll have the full results of our testing for you.
Until then, I’d be remiss if I didn’t invite you to check out our hosting plans, or take a WPMU DEV membership (Incl. 1 Bronze level hosted site) for a free 7 day trial.
That way you can see how our hosting performs for yourself and run your own tests following our methodology (or any other you prefer).
If you’d rather wait for the results before you give DEV hosting a try, that’s cool too.
See you on the next one for the reveal.
Source: premium.wpmudev.org